22 Jun 2022
13 mins readWhy JVM modern profilers are still safepoint biased?
Introduction
I presented in my previous blog post how debug symbols are generated and used to resolve frames in exception stacktraces.
Beside exceptions, stacktraces are also used extensively in profilers. The old profiler generation was based on JVMTI GetAllStackTraces API (or equivalent) with the known issue related to this technique (safepoint bias).
The new one is based on the AsyncGetCallTrace, an undocumented API which does not require all threads to be at safepoint to collect stacktraces. Nitsan Wakart was describing its mechanism in this post.
In this article we will explore the consequences for those profilers which rely on debug symbols resolution described earlier.
Async-Profiler / Honest profiler
One of the most popular profiler based on AsyncGetCallTrace is Async-Profiler by Andrei Pangin. Async-Profiler calls AsyncGetCallTrace to collect stacktraces even if threads are not at safepoint.
Honest Profiler by Richard Warburton is using the same API call.
JFR
JDK Flight Recorder, for method sampling, uses a timer and at each regular interval pick max 5 Java threads, verifies that those threads are executing Java code
(internal state maintained by the JVM) and collects stacktraces in a very similar way than AsyncGetCallTrace, though they don’t share the same code.
JFR is able to collect at any point of the code because waiting for a safepoint is not required.
Last frame resolution
Once stacktraces are collected, they are resolved against debug symbols emitted by the JVM (interpreter or JIT) as described in my previous post. If you look at stacktraces, the bottom of the stack is just a list of frames. Some are real frames (with a real call to a method) and others are virtual frame, when code was in fact inlined into the caller (a real frame). As we learned previously, calls are at a safepoint with all debug information required to resolve them as a pair of method name and line number. A safepoint is a point into the code where the stak is walkable safely with all debug information available and objects reachable. Note that VM operations (like GC) that needs to stop all the threads and a safepoint are 2 different things. Halted threads are all at safepoint to perform the VM operation safely.
Only the last frame where the code is currently executing can be anywhere inside a method, including outside of a safepoint. If we are outside a safepoint we don’t have debug information so we cannot resolve this last frame correctly. Also it’s pretty hard to map back to the actual line number information because of the optimization/inlined code that can blur the lines (see also this post).
How JFR & AsyncGetCallTrace manage to get this last frame? Is the information accurate? Do we have line number precision?
Async-Profiler
Async-Profiler provides several output formats:
- flamegraph (svg/html)
- text (flat/traces/collapsed)
- JFR
For the first 2, where AsyncGetCallTrace is used, you will never see line numbers as the author chose to not process/display them.
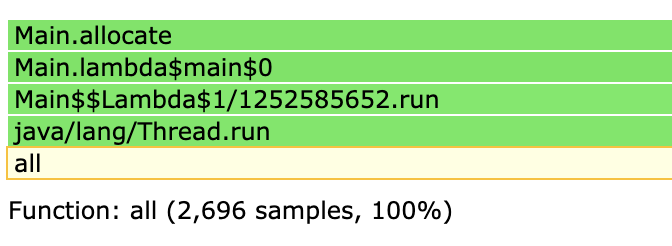
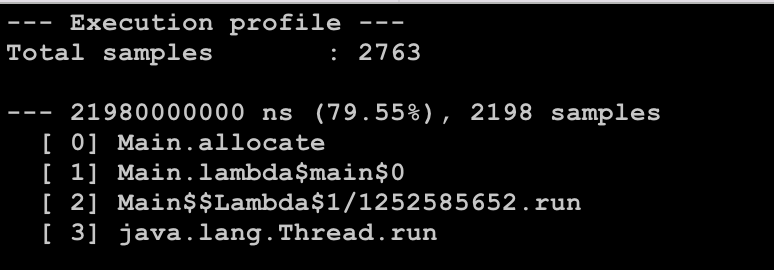
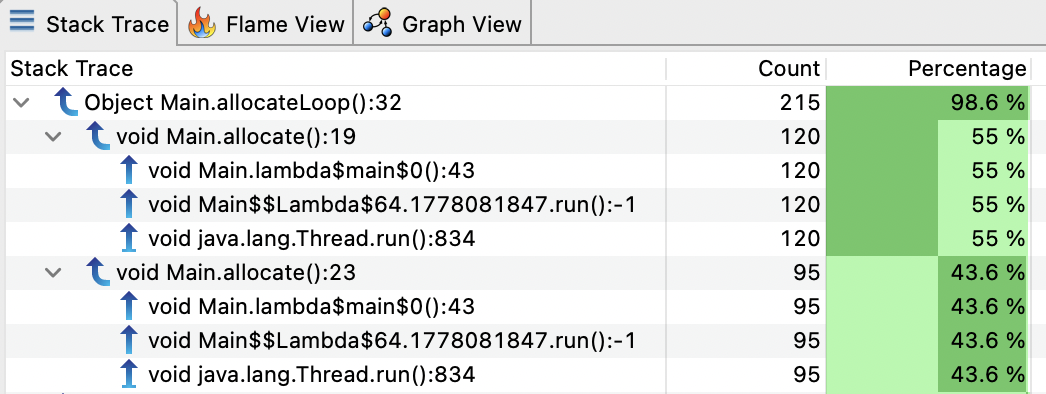
For JFR output, line numbers are transfered/preserved from AsyncGetCallTrace to the JFR file format. This way, we can open the file with JDK Mission Control (JMC) to see what line is resolved for the last frame.

Honest Profiler
Honest Profiler can report line numbers with flat profiles:
Flat Profile (by line):
	(t  2.6,s  2.6) Profile::noLoopBench @ (bci=291,line=140)
	(t  2.6,s  2.6) Profile::noLoopBench @ (bci=607,line=164)
	(t  2.5,s  2.5) Profile::noLoopBench @ (bci=212,line=134)
	(t  2.5,s  2.5) Profile::noLoopBench @ (bci=370,line=146)
	(t  2.5,s  2.5) Profile::noLoopBench @ (bci=449,line=152)
	(t  2.5,s  2.5) Profile::noLoopBench @ (bci=537,line=159)
	(t  2.5,s  2.5) Profile::noLoopBench @ (bci=181,line=132)
	(t  2.5,s  2.5) Profile::noLoopBench @ (bci=142,line=129)
	(t  2.4,s  2.4) Profile::noLoopBench @ (bci=339,line=144)
	(t  2.4,s  2.4) Profile::noLoopBench @ (bci=528,line=158)
	(t  2.4,s  2.4) Profile::noLoopBench @ (bci=133,line=128)
	(t  2.3,s  2.3) Profile::noLoopBench @ (bci=300,line=141)
	(t  2.3,s  2.3) Profile::noLoopBench @ (bci=616,line=165)
	(t  2.3,s  2.3) Profile::noLoopBench @ (bci=102,line=126)
	(t  2.3,s  2.3) Profile::noLoopBench @ (bci=497,line=156)
	(t  2.3,s  2.3) Profile::noLoopBench @ (bci=260,line=138)
	(t  2.2,s  2.2) Profile::noLoopBench @ (bci=221,line=135)
	(t  2.2,s  2.2) Profile::noLoopBench @ (bci=458,line=153)
	(t  2.2,s  2.2) Profile::noLoopBench @ (bci=576,line=162)
	(t  2.2,s  2.2) Profile::noLoopBench @ (bci=379,line=147)
JFR
The recording format allow line number information or the Bytecode Index to be stored for each frame and in JMC you can distinguish by line number. Useful if you have a method that have multiple calls to the same method. Without the line information it is more difficult to correlate
Debug information and safepoints
By default, debug information are recorded by the JIT where safepoint are emitted, for example when a method is called, which is convenient for building stacktraces for exception.
However, with sampling profiling like done with AsyncGetCallTrace, if we want to resolve the last frame with debug information, we need to look for nearby safepoints.
When the JVM has found that the current PC is in a Java frame, it tries to get the actual debug information (called PCDesc) with the method CompiledMethod::pc_desc_at() called from here for AsyncGetCallTrace.
If the PCDesc is not found, it will then try to found the nearest “below” by searching toward the end of the method with CompiledMethod::pc_desc_near() called from here for AsyncGetCallTrace and here for JFR.
To demonstrate this behavior let’s take a contrive example:
L117 public static int noLoopBench(int idx) {
L118     int res = idx * idx;
         res += (idx % 7) + idx * 31;
	 res -= (idx * 53) % 13 - idx;
	 res += idx * 1003 - (idx * 13 % 7);
	 res += (idx % 19) + idx * 37;
	 res -= (idx * 71) % 7 - idx;
	 res += idx * 97 - (idx * 53 % 29);
	 res += (idx % 7) + idx * 31;
	 res -= (idx * 53) % 13 - idx;
	 // ... skip for brevity ...
	 res += idx * 1003 - (idx * 13 % 7);
	 res += (idx % 19) + idx * 37;
	 res -= (idx * 71) % 7 - idx;
	 res += idx * 97 - (idx * 53 % 29);
L167	 return res;
    }
Full code here
We profile this method with Async-Profiler with JFR output by attaching the profiler on the running program:
java Profile &
./profiler.sh -d 30 -e itimer -o jfr -f profile_noLoop.jfr <pid>
Here how it looks in JMC:

The method is almost 50 lines long, but we have only the first line in almost all samples. There is no debug information generated (no safepoint) for the whole method, except at the entry. What we would have expected in that case is a uniform distribution of the samples across all the lines of the method. But instead, when samples are taken, the nearest safepoint is found and symbol are resolved with debug information associated with it.
Let’s try another example with loops now:
L72 public static int loopsBench(int idx) {
L73     int res = 0;
	for (int i = 0; i < 5; i++) {
	    dst[i] = buffer[i];
	}
	res += dst[buffer.length-1] == 1 ? buffer[0] : buffer[1];
	for (int i = 0; i < 5; i++) {
	    dst[i] = buffer[i];
	}
	res += dst[buffer.length-1] == 1 ? buffer[0] : buffer[1];
	for (int i = 0; i < 5; i++) {
	    dst[i] = buffer[i];
	}
	// ... skip for brevity ...
	res += dst[buffer.length-1] == 1 ? buffer[0] : buffer[1];
L114	return res;
    }

Only 2 lines are reported (73 & 77). But in our example loops are in fact counted loops which are handled specially by the JIT, i.e. no safepoint are emitted. Let’s try with long loop instead:
L72 public static int loopsBench(int idx) {
L73     int res = 0;
	for (long i = 0; i < 5; i++) {
	    dst[(int)i] = buffer[(int)i];
	}
	res += dst[buffer.length-1] == 1 ? buffer[0] : buffer[1];
	for (long i = 0; i < 5; i++) {
	    dst[(int)i] = buffer[(int)i];
	}
	res += dst[buffer.length-1] == 1 ? buffer[0] : buffer[1];
	for (long i = 0; i < 5; i++) {
	    dst[(int)i] = buffer[(int)i];
	}
	// ... skip for brevity ...
	res += dst[buffer.length-1] == 1 ? buffer[0] : buffer[1];
L114	return res;
    }
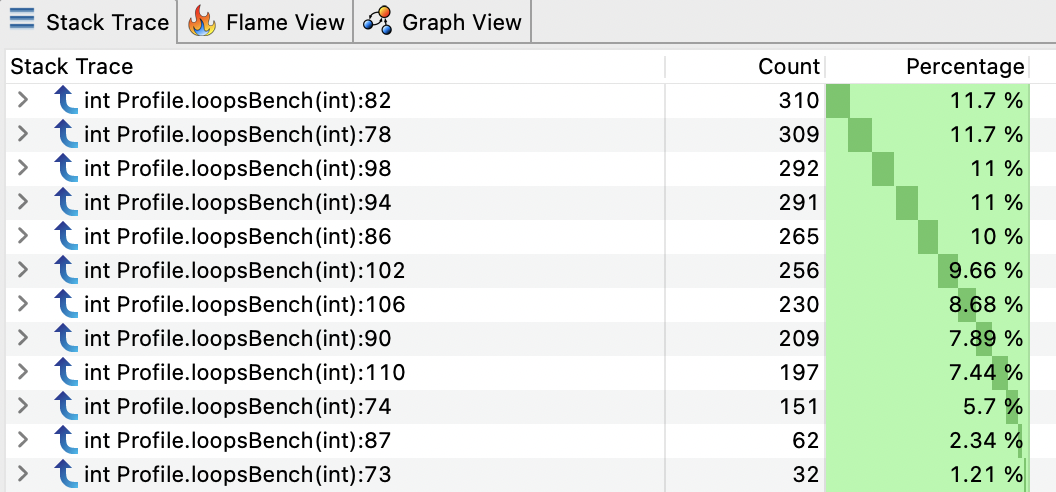
Now we have our nicely distributed samples for the whole method! But what about inlining?
I have also crafted an example with 3 different small methods that will be inlined:
    public static int inlinedBench(int idx) {
L28     int res = 0;
        res += compute1(idx);
        res += compute1(res);
        res += compute1(res);
        res += compute1(res);
        res += compute1(res);
        res += compute1(res);
        res += compute1(res);
        res += compute1(res);
        res += compute1(res);
        res += compute1(res);
        res += compute1(res);
        res += compute1(res);
        res += compute1(res);
        res += compute1(res);
        res += compute1(res);
        res += compute1(res);
        res += compute1(res);
        res += compute1(res);
        res += compute1(res);
        res += compute1(res);
        res += compute1(res);
        res += compute1(res);
        res += compute1(res);
        res += compute1(res);
        res += compute1(res);
        res += compute1(res);
        res += compute1(res);
        res += compute1(res);
        return res;
    }

    private static int compute1(int value) {
L61     return (value % 7) + value * 31 + compute2(value);
    }

    private static int compute2(int value) {
L65     return (value * 53) % 13 - value + compute3(value);
    }

    private static int compute3(int value) {
L69     return value * 1003 - (value * 13 % 7);
    }

Only one line is reported, so no safepoint emitted when methods are inlined.
And if we disable inlining:
java -XX:-Inline Profile

We found our computeX methods and if we expand one node:
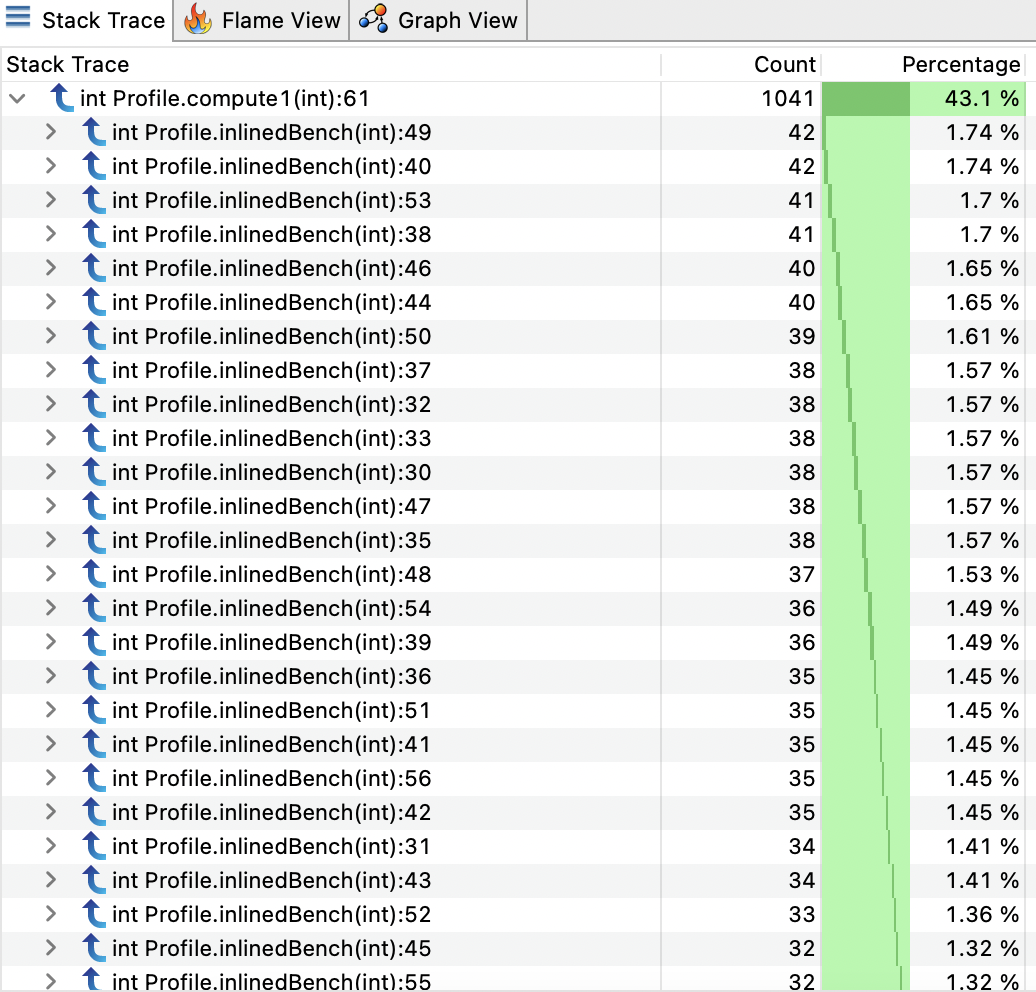
Samples are now distributed over the whole inlinedBench method.
DebugNonSafepoint
There is an interesting flag that modifies slightly the behavior described above: -XX:+UnlockDiagnosticVMOptions -XX:+DebugNonSafepoints. This flag activates the recording of more debug information about PC even if it’s not at safepoint. It means we can have a more precise location for stacktraces.
The more debug information, the more sample will be precised in line number resolution.
Let’s try this flag with our first example:
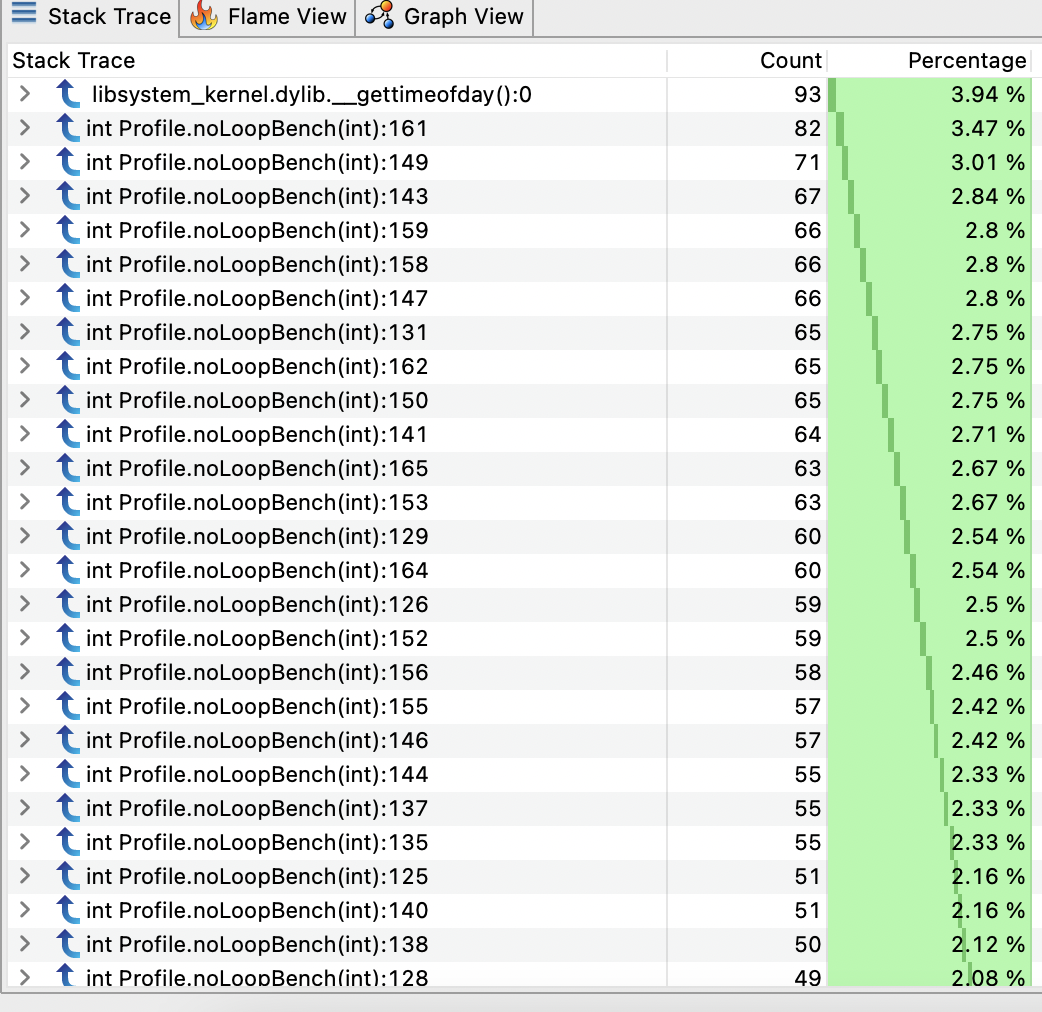
Now we have more samples distributed across the noLoopBench method.
What about inlining?
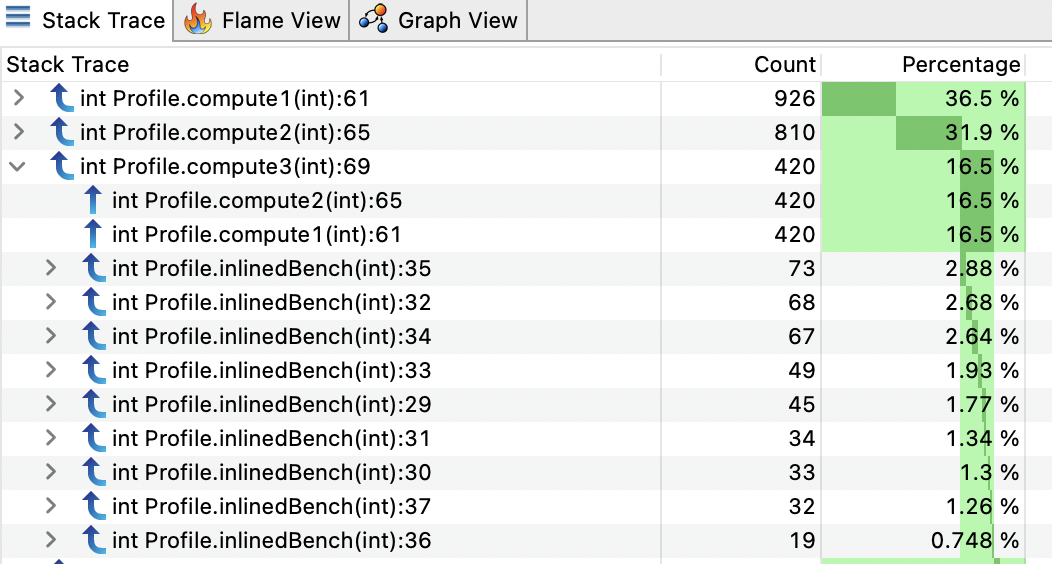
Now we have all information about the inlined methods with line numbers where they are called.
Auto-activation DebugNonSafepoint
We saw that there is a JVM flag to enable debug information without safepoint, but there are also 2 cases where DebugNonSafepoint is automatically activated:
JVMTI
If a JVMTI agent registers a callback CompiledMethodLoad, the flag will be activated. Async-Profiler is doing it here. Honest Profiler is doing the same here.
If you start a JVM with these JVMTI agents on the command line (-agentpath:profiler.so, the flag will be activated from the start, and all compiled methods will generate debug information outside of safepoints. However, if you attach the agent on the running instance, flag will be enabled only when attached. Then, only new compiled methods will benefit from the flag, and already compiled methods will still have only debug information for safepoints.
PrintAssembly/CompileCommand
If you want to print the assembly code of a method, it will also activate the flag for having more useful information of the assembly for matching with bytecode/line numbers.
JFR
JFR is not activating by default DebugNonSafepoint. You have to enable it manually. This was recommended at some point by JFR doc.
Performance impact
I have put the code of noLoopBench method into a JMH benchmark with and without DebugNonSafepoint flag and found no significant difference.
Benchmark                          Mode  Cnt    Score   Error  Units
MyBenchmark.testDebugNonSafepoint  avgt   25  156.209 ± 1.711  ns/op
MyBenchmark.testDefault            avgt   25  159.069 ± 2.260  ns/op
It makes sense where the flag will only be generating more debug information (map PC -> BCI -> Line numbers) at JIT compilation time. It will only consume more native memory for storage but will not impact runtime performance of the application.
There are some caveats about using DebugNonSafepoint. We may have information about stacktraces outside of safepoint. However, it does not mean it’s more accurate about time spent on a method reported by profiling tools. See JDK-8201516 and JDK-8281677.
Conclusion
Even though new profilers using AsyncGetCallTrace or similar technique are not safepoint biased for collecting stacktraces, the resolution of the last frame is still biased towards the recorded debug information. And by default, they are at safepoint! That’s why those profilers try to activate the flag DebugNonSafepoint as soon as possible to have more precise resolution.
I see no problem to always activate the flag, even in production, with the caveat to watch for native memory consumption. It will help you profile continuously in production.
References
- The Pros and Cons of AsyncGetCallTrace Profilers by Nitsan Wakart
- Safepoints: Meaning, Side Effects and Overheads by Nitsan Wakart
- Why (Most) Sampling Java Profilers Are Fucking Terrible by Nitsan Wakart
- How Inlined Code Makes For Confusing Profiles by Nitsan Wakart
- Honest profiler
- Async-Profiler
- JDK-8201516
- JDK-8281677
Thanks to Christophe Nasarre, Marcus Hirt & Nitsan Wakart for the review.