22 Mar 2022
10 mins readInside JVM debug symbols
When working on the JVM, almost all stacktraces you see provide source file name and line numbers. For example, here is stacktrace associated with an exception:
java.lang.RuntimeException: Expected: controller used to showcase what happens when an exception is thrown
        at org.springframework.samples.petclinic.system.CrashController.triggerException(CrashController.java:36) ~[classes!/:2.2.0.BUILD-SNAPSHOT]
        at sun.reflect.NativeMethodAccessorImpl.invoke0(Native Method) ~[na:1.8.0_272]
        at sun.reflect.NativeMethodAccessorImpl.invoke(NativeMethodAccessorImpl.java:62) ~[na:1.8.0_272]
 // ... skipped for brevity ...
        at org.apache.tomcat.util.threads.TaskThread$WrappingRunnable.run(TaskThread.java:61) [tomcat-embed-core-9.0.45.jar!/:na]
        at java.lang.Thread.run(Thread.java:748) [na:1.8.0_272]
The rest of this post details how does the JVM manage to keep track of these line information without resorting to any additional files (debug symbols), and especially with JITed code.
javac
The first step is with java compiler javac. You can use -g option to include/exclude the debug information in the compiled classfile:
javac --help
...
  -g                           Generate all debugging info
  -g:{lines,vars,source}       Generate only some debugging info
  -g:none                      Generate no debugging info
...
javac defaults:
By default, javac generates line number and source file but no local variable information.
Let’s take a simple example:
public class LineNumbers {
    public static void main(String[] args) {
        throw new RuntimeException("boo");
    }
}
javac LineNumbers.java && java LineNumbers
Exception in thread "main" java.lang.RuntimeException: boo
	at LineNumbers.main(LineNumbers.java:3)
As expected with the defaults, line number information from where the exception was thrown is displayed. If you exclude the debug information, both file and line number are unknown:
javac -g:none LineNumbers.java && java LineNumbers
Exception in thread "main" java.lang.RuntimeException: boo
	at LineNumbers.main(Unknown Source)
We can inspect the classfile compiled with -g:none with javap
javap -v LineNumbers.class
Classfile LineNumbers.class
  Last modified Mar 2, 2022; size 269 bytes
  MD5 checksum b62074a0ce6b44279a6fc3b347132cd0
public class LineNumbers
  minor version: 0
  major version: 55
  flags: (0x0021) ACC_PUBLIC, ACC_SUPER
  this_class: #5                          // LineNumbers
  super_class: #6                         // java/lang/Object
  interfaces: 0, fields: 0, methods: 2, attributes: 0
Constant pool:
   #1 = Methodref          #6.#12         // java/lang/Object."<init>":()V
   #2 = Class              #13            // java/lang/RuntimeException
   #3 = String             #14            // boo
   #4 = Methodref          #2.#15         // java/lang/RuntimeException."<init>":(Ljava/lang/String;)V
   #5 = Class              #16            // LineNumbers
   #6 = Class              #17            // java/lang/Object
   #7 = Utf8               <init>
   #8 = Utf8               ()V
   #9 = Utf8               Code
  #10 = Utf8               main
  #11 = Utf8               ([Ljava/lang/String;)V
  #12 = NameAndType        #7:#8          // "<init>":()V
  #13 = Utf8               java/lang/RuntimeException
  #14 = Utf8               boo
  #15 = NameAndType        #7:#18         // "<init>":(Ljava/lang/String;)V
  #16 = Utf8               LineNumbers
  #17 = Utf8               java/lang/Object
  #18 = Utf8               (Ljava/lang/String;)V
{
  public LineNumbers();
    descriptor: ()V
    flags: (0x0001) ACC_PUBLIC
    Code:
      stack=1, locals=1, args_size=1
         0: aload_0
         1: invokespecial #1                  // Method java/lang/Object."<init>":()V
         4: return

  public static void main(java.lang.String[]);
    descriptor: ([Ljava/lang/String;)V
    flags: (0x0009) ACC_PUBLIC, ACC_STATIC
    Code:
      stack=3, locals=1, args_size=1
         0: new           #2                  // class java/lang/RuntimeException
         3: dup
         4: ldc           #3                  // String boo
         6: invokespecial #4                  // Method java/lang/RuntimeException."<init>":(Ljava/lang/String;)V
         9: athrow
}
Let’s do the same for the classfile generated with -g option (full debug info):
Classfile /Users/jean-philippe.bempel/projects/tmp/LineNumbers.class
  Last modified Mar 2, 2022; size 460 bytes
  MD5 checksum fb5afda47b438ece75b4e4121d8e4786
  Compiled from "LineNumbers.java"
public class LineNumbers
  minor version: 0
  major version: 55
  flags: (0x0021) ACC_PUBLIC, ACC_SUPER
  this_class: #5                          // LineNumbers
  super_class: #6                         // java/lang/Object
  interfaces: 0, fields: 0, methods: 2, attributes: 1
Constant pool:
   #1 = Methodref          #6.#20         // java/lang/Object."<init>":()V
   #2 = Class              #21            // java/lang/RuntimeException
   #3 = String             #22            // boo
   #4 = Methodref          #2.#23         // java/lang/RuntimeException."<init>":(Ljava/lang/String;)V
   #5 = Class              #24            // LineNumbers
   #6 = Class              #25            // java/lang/Object
   #7 = Utf8               <init>
   #8 = Utf8               ()V
   #9 = Utf8               Code
  #10 = Utf8               LineNumberTable
  #11 = Utf8               LocalVariableTable
  #12 = Utf8               this
  #13 = Utf8               LLineNumbers;
  #14 = Utf8               main
  #15 = Utf8               ([Ljava/lang/String;)V
  #16 = Utf8               args
  #17 = Utf8               [Ljava/lang/String;
  #18 = Utf8               SourceFile
  #19 = Utf8               LineNumbers.java
  #20 = NameAndType        #7:#8          // "<init>":()V
  #21 = Utf8               java/lang/RuntimeException
  #22 = Utf8               boo
  #23 = NameAndType        #7:#26         // "<init>":(Ljava/lang/String;)V
  #24 = Utf8               LineNumbers
  #25 = Utf8               java/lang/Object
  #26 = Utf8               (Ljava/lang/String;)V
{
  public LineNumbers();
    descriptor: ()V
    flags: (0x0001) ACC_PUBLIC
    Code:
      stack=1, locals=1, args_size=1
         0: aload_0
         1: invokespecial #1                  // Method java/lang/Object."<init>":()V
         4: return
      LineNumberTable:
        line 1: 0
      LocalVariableTable:
        Start  Length  Slot  Name   Signature
            0       5     0  this   LLineNumbers;

  public static void main(java.lang.String[]);
    descriptor: ([Ljava/lang/String;)V
    flags: (0x0009) ACC_PUBLIC, ACC_STATIC
    Code:
      stack=3, locals=1, args_size=1
         0: new           #2                  // class java/lang/RuntimeException
         3: dup
         4: ldc           #3                  // String boo
         6: invokespecial #4                  // Method java/lang/RuntimeException."<init>":(Ljava/lang/String;)V
         9: athrow
      LineNumberTable:
        line 3: 0
      LocalVariableTable:
        Start  Length  Slot  Name   Signature
            0      10     0  args   [Ljava/lang/String;
}
SourceFile: "LineNumbers.java"
The differences between the 2 outputs are:
- a
LineNumberTablesection added for each method like:LineNumberTable: line 3: 0 - a
LocalVariableTablesection added for each method like:LocalVariableTable: Start Length Slot Name Signature 0 10 0 args [Ljava/lang/String; - an attribute
SourceFileindicating the name of the source file compiled from:SourceFile: "LineNumbers.java"
Indices used in those tables are called ByteCode Index (BCI). BCI are offsets from the beginning of the method where a bytecode instruction starts.
The LineNumberTable is a mapping between line numbers inside the source file and BCIs.
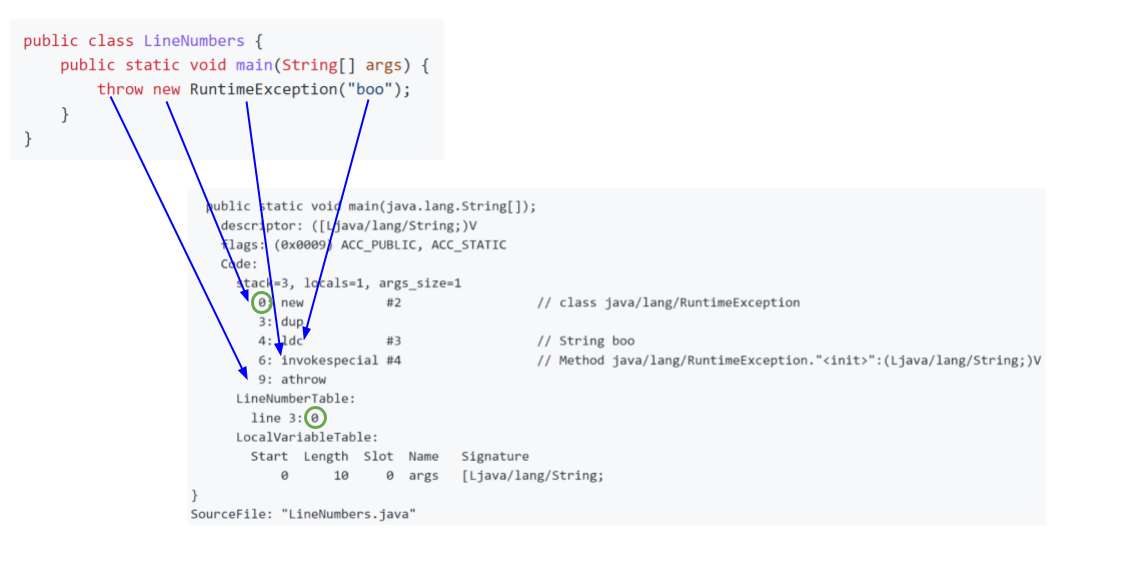 In the example above, At line 3 corresponds to the BCI 0 of the method, the first bytecode instruction.
sizes
What is the impact on the classfile size?
I took 2 different files:
LineNumbers.java, the file we created above, quite smallCommandLine.javais the single source file from Picocli project
| SourceFile | -g:none | -g | % |
|---|---|---|---|
| LineNumbers.java | 269B | 460B | +71% |
| CommandLine.java | 64,273B | 80,074B | +24% |
Gradle defaults:
Gradle invokes javac with -g by default:
maven defaults:
Maven invokes javac with -g by default:
Exception stacktraces
We have line numbers inside the classfile, but when and where are these line resolved?
Stacktraces are in fact collected when exceptions are instantiated through the call to fillInStackTrace()
This is calling the JVM via java_lang_Throwable::fill_in_stack_trace
and stores it into the backtrace field in Throwable class as a list of pointers (or handles) to method metadata from the interpreter state and the BCI (ByteCode Index).
Then, only when you call getStackTrace() or printStackTrace() on an exception, it will take this backtrace to fill out StackTraceElement array:
java_lang_Throwable::get_stack_trace_elements
tries to resolve symbol names and line numbers with the help of:
ConstantPool::source_file_nameto fetch the source file name from the constant pool of the classMethod::line_number_from_bcito use the LineNumber Table to translate BCI to line number.
For the interpreter it seems obvious that there is a 1:1 mapping between the current state of execution of the bytecode and the source file/line number. But what about JITed code?
C2 JIT compiler
We saw previously that, for the interpreter, we have a mapping inside the classfile between source line number and BCI. With JITed code we now need a mapping between PC (Program Counter) or IP (Instruction Pointer) and BCI.
To reuse our example from above, we have java source line:
L3: throw new RuntimeException("boo");
bytecode in classfile:
 0: new           #2                  // class java/lang/RuntimeException
 3: dup
 4: ldc           #3                  // String boo
 6: invokespecial #4                  // Method java/lang/RuntimeException."<init>":(Ljava/lang/String;)V
 9: athrow
and JITed code:
  0x000000011a3d2120: mov    %eax,-0x14000(%rsp)
  0x000000011a3d2127: push   %rbp
  0x000000011a3d2128: sub    $0x10,%rsp         ;*synchronization entry
                                                ; - LineNumbers::main@-1 (line 3)

  0x000000011a3d212c: mov    $0x2,%esi
  0x000000011a3d2131: xchg   %ax,%ax
  0x000000011a3d2133: call   0x00000001128b2e00  ; ImmutableOopMap{}
                                                ;*new {reexecute=0 rethrow=0 return_oop=0}
                                                ; - LineNumbers::main@0 (line 3)
                                                ;   {runtime_call UncommonTrapBlob}
From the JITed code, at the current address of execution (or Program Counter), we need to have the mapping from it to the corresponing BCI. Then from the BCI, we use the LineNumberTable to get the source line number. This PC/BCI mapping is generated and recorded by the JIT itself.
When compiling a method, a debug information recorder is started, and, at each method call site inside the body of the current one, a safepoint is inserted.
See the comment describing its purpose:
//** The DebugInformationRecorder collects debugging information
//   for a compiled method.
//   Debugging information is used for:
//   - garbage collecting compiled frames
//   - stack tracing across compiled frames
//   - deoptimizating compiled frames
A safepoint is a point in the code where it is safe for an application’s threads to be suspended to do some VM operations. For example, it is used for Garbage Collection to scan the thread stack for object root references. When a thread is suspended at a safepoint, the thread’s state is perfectly known. The local variables and registers which may contain reference to object have been saved in a local structure used by the VM to track such objects. The JIT also use those properties of the safepoint to record at the same time the debug information.
Those safepoints are emitted by the JIT compiler at strategic places to balance the execution speed and reactivity to suspend the thread. It’s also a trade-off for debug information recording because, usually, it may have more machine instructions than bytecode instructions and we cannot store all the mappings from PC to BCI. So we keep only the mapping at the safepoint.
Recorded information are:
- OopMap: Set of object references that are reachable from the current method (registers or stack)
- scope (JVM state, locals, stack expressions (stack machine parlance))
- current BCI
JVM state is a list of interpreter state + GC roots for the current active call and all inlined methods. This is the way debug symbols are also mapped for inlined methods.
Those information are recorded in 3 phases:
- add_safepoint
- describe_scope for every scope. There is one scope per JVMState, one for current compiling method and one per inlined method in it. Each scope will record the current PC (Program Counter) and the BCI associated.
- end_safepoint
Now back to our exception: how stacktraces are resolved from JITed code? In the java_lang_Throwable::fill_in_stack_trace method, if a compiled (native) method is associated to the frame that we are examining, JVM is opening the debug recording stream that was written during JIT compilation, and reads the method metadata and the BCI. These information will then be used like for the interpreted version.
The above-described mechanism gives precised and accurate stacktraces for exceptions because each frame in the stack is a call and it’s done at a safepoint. That way we have the exact mapping from PC to BCI and finally to source line number.
References
- javac manual
- OpenJDK Debug Information Recorder
- Gradle CompileOptions::isDebug
- Gradle JavaCompilerArgumentsBuilder::addMainOptions
- Maven compiler:compile <debug> parameter
- Maven compiler:compile <debuglevel> parameter
Thanks to Ludovic Henry and Christophe Nasarre for the review.