01 Dec 2023
16 mins readChasing a Metaspace leak
Introduction
I have recently chased a bug into OpenJDK that was here since at least JDK 8, here is the story of my journey to identify and fix it.
Context
At Datadog, I am working on the Dynamic Instrumentation product. As the name suggests it instruments any part of the code dynamically by inserting code that captures execution context and the state (stack traces, fields, arguments local variables), generates logs, metrics, span or span tags. On the JVM, we are, of course, relying heavily on the instrumentation API for doing this, which is a supported API that has been available for many years (introduced since JDK 1.5). We have in place, along our backend, a demo application (based on Spring PetClinic) used to continuously verify that the basic features are working as expected. One day, we noted that the pod that was running this demo, was periodically restarted. Our journey started!
Troubleshooting
The first step is to understand the reason for the restarts. Just by looking at the pod description (OOMkill), we could see that the reason is that the memory used by the pod exceeds the limit of the container.
Maybe we overlooked the sizing of the container and what is required by the demo to run correctly? The Java heap will not go beyond what we configured as the Xmx but for the native part, it’s another story: Metaspace, code cache, GC structs, VM structs, there are plenty of reasons the spaces can grow. But increasing the container memory was not sufficient.
So, a deeper analysis was required. While looking at all native spaces, Metaspace was the one that correlates the increase of RSS memory of the process:
![]()
Did we have a class/classloader leak?
Checking with the command jcmd <pid> VM.metaspace or looking at JFR recordings, the number of classes were still stable.
By default, Metaspace is unbounded: it can increase its size until there is no more memory on the host/container. But we can cap it with the -XX:MaxMetaspaceSize JVM argument. Let’s put it at something reasonable to avoid this OOMkill.
It turned out that we reached the maximum of the Metaspace and OutOfMemoryError (OOME) exception was thrown but leaving the process alive in a bad state. This was worse than the OOMkill in a container environment, which will automatically restart the container.
I was not sure if the Metaspace triggers a GC to reclaim unused classes in those circumstances, so I verified it in the OpenJDK code.
The allocation for Metaspace happens using the Metaspace::allocate method that attempts an allocation and if no allocation is possible because the Metaspace is full, it calls the CollectedHeap::satisfy_failed_metadata_allocation method that will trigger a special VM operation: VM_CollectForMetadataAllocation at safepoint and will trigger a GC (for G1 a concurrent cycle, otherwise a Full GC) with cause: Metadata Threshold. So, if an OOME is thrown, it means we have really not enough space or that a leak is happening.
The goal of our demo application is to verify that our instrumentation is working as expected. This instrumentation is done through a java.lang.instrumentation.ClassFileTransformer registered through Instrumentation API. When a class is loaded, the transformer checks if this class needs to instrumented or not. But what if the class is already loaded and we need to instrument it? In this case, we use the Instrumentation::retransformClasses method. For our demos we are continuously (every minute) trying to retransform the same class to inject code.
Let’s speed up the process by tight looping on this retransformation: instantly, we were filling up the Metaspace and got OOME (when capped).
Now, we have the source of this increase. But is it really a leak, or a problem with Metaspace fragmentation?
Here I recommend the read of the blog posts from Thomas Stuefe about Metaspace.
Reproducer
Even with the source of the problem found, coming up with a PetClinic app showing there is a leak and posting it to an OpenJDK mailing list didn’t sound like a good idea. We needed to find a minimal reproducer that everybody can play with and try some small modifications to understand the root cause. Our demo is a modified version of the original PetClinic. So I tried to clone the original version and to reproduce our issue. But I failed. The original code of the class we are targeting to retransform was not including the thing that triggers our leak. Therefore the strategy was to bisect the code to diff the trigger. Our modification is not huge so I could proceed step by step. I commented out some large portions of code and checked if the issue was still there. After several iterations I found the portion of code that seems to be the culprit:
  private void syntheticSpan() {
    Tracer tracer = GlobalTracer.get();
    Span synSpan = tracer.buildSpan("synthetic").withTag(Tags.SPAN_KIND, Tags.SPAN_KIND_CLIENT).start();
    try (Scope scope = tracer.activateSpan(synSpan)) {
      LockSupport.parkNanos(Duration.ofMillis(VETS_SYNTHETIC_SPAN_SLEEP_MS).toNanos());
    }
    finally {
      synSpan.finish();
    }
  }
For our demo, I am generating synthetic spans with the above code. Commenting the full method was not generating any leak. But the moment I added the try-with-resources statement, the issue was triggered. Let’s verify with a small reproducer:
class MyClass {
    private static void writeFile() {
      try (TWR twr = new TWR()) {
        twr.process();
      }
    }

    static class TWR implements AutoCloseable {
        public void process() {}
        @Override
        public void close() {}
    }
}
The code for the retransformation is added as a java agent:
public class Agent {
    public static void premain(String arg, Instrumentation inst) {
        new Thread(() -> retransformLoop(inst, arg)).start();
    }

    private static void retransformLoop(Instrumentation instrumentation, String className) {
        Class<?> classToRetransform = null;
        while (true) {
            if (classToRetransform == null) {
                for (Class<?> clazz : instrumentation.getAllLoadedClasses()) {
                    if (clazz.getName().equals(className)) {
                        System.out.println("found class: " + className);
                        classToRetransform = clazz;
                        break;
                    }
                }
            }
            if (classToRetransform != null) {
                try {
                    instrumentation.retransformClasses(classToRetransform);
                    //Thread.sleep(1);
                } catch (Exception e) {
                    throw new RuntimeException(e);
                }
            }
        }
    }
}
and run with :
java -javaagent:agent.jar=MyClass -XX:MaxMetaspaceSize=128M -cp . RetransformLeak
Note: No ClassFileTransformer is registered here, we are just invoking the retransform operation while no modification of the bytecode is required.
With this setup, I could easily reproduce the leak and I could confidently report this problem to the OpenJDK mailing list:
Finding the root cause
With that reproducer, I was now confident that someone will find the exact root cause of this leak and a patch will be made for fixing it. My curiosity was too strong and I kept on investigating the leak to understand it. Let’s focus on the try-with-resources: This is only a syntactic sugar, let’s use a decompiler to get basic structure of an equivalent:
  TWR var0 = new TWR();
  try {
      var0.process();
  } catch (Throwable var4) {
      try {
          var0.close();
      } catch (Throwable var3) {
          var4.addSuppressed(var3);
      }
      throw var4;
  }
  var0.close();
Playing now with this code, I noticed when I comment the line var4.addSuppressed(var3); the leak disapears. Sounds like there is something fishy with that catch block.
Using catch with Throwable is not something you do everyday: usually you are using a catch (Exception ex).
let’s try to focus more on this:
class MyClass {
    private static void m() {
        try {
            int i = 42;
        } catch (Throwable t) {
            t.printStackTrace();
        }
    }
}
By just adding a catch (Throwable t) and using the throwable variable by calling a method, I was able to leak the Metaspace during the retransformation! Here is my final minimal reproducer. Sounds stupidly silly!
But what happens if I replace by the usual Exception instead of Throwable? No more leak!
With this minimal reproducer, it was then easier to understand what’s happening during the retransform operation. Though, I had no clue where to look into the JVM code to start digging. One idea was to use the JVM flag -XX:+CrashOnOutOfMemoryError that will give me more context on the OutOfmemoryError raised by the Metaspace.
Here the stacktrace:
Stack: [0x00007f8d9c400000,0x00007f8d9c500000],
sp=0x00007f8d9c4fdb80, free space=1014k
Native frames: (J=compiled Java code, j=interpreted, Vv=VM code, C=native code)
V [libjvm.so+0xf9f4e7] VMError::report_and_die(int, char const*, char const*, __va_list_tag*, Thread*, unsigned char*, void*, void*, char const*, int, unsigned long)+0x197 debug.cpp:368)
V [libjvm.so+0x672eab] report_fatal(VMErrorType, char const*, int, char const*, ...)+0x12b
V [libjvm.so+0x67315d] report_java_out_of_memory(char const*)+0xed
V [libjvm.so+0xc238d0] Metaspace::report_metadata_oome(ClassLoaderData*, unsigned long, MetaspaceObj::Type, Metaspace::MetadataType, JavaThread*)+0x260
V [libjvm.so+0xc23b33] Metaspace::allocate(ClassLoaderData*,unsigned long, MetaspaceObj::Type, JavaThread*)+0x133
V [libjvm.so+0x650e8b] ConstantPool::allocate(ClassLoaderData*, int, JavaThread*)+0x7b
V [libjvm.so+0xae518c] VM_RedefineClasses::merge_cp_and_rewrite(InstanceKlass*, InstanceKlass*, JavaThread*)+0x4c
V [libjvm.so+0xae6e6d] VM_RedefineClasses::load_new_class_versions()
[clone .part.0]+0x34d
V [libjvm.so+0xae794f] VM_RedefineClasses::doit_prologue()+0x17f
V [libjvm.so+0xfa8ee0] VMThread::execute(VM_Operation*)+0x40
V [libjvm.so+0xab416f] JvmtiEnv::RetransformClasses(int, _jclass*const*)+0x2bf
V [libjvm.so+0xa5f04c] jvmti_RetransformClasses+0xfc
C [libinstrument.so+0x4e86] retransformClasses+0x1b6
J 182 sun.instrument.InstrumentationImpl.retransformClasses0(J[Ljava/lang/Class;)V java.instrument@20.0.1 (0 bytes) @ 0x00007f8d886d8077 [0x00007f8d886d7fa0+0x00000000000000d7]
J 181 c1 sun.instrument.InstrumentationImpl.retransformClasses([Ljava/lang/Class;)V java.instrument@20.0.1 (33 bytes) @ 0x00007f8d80c29a5c [0x00007f8d80c29860+0x00000000000001fc]
j Agent.retransformLoop(Ljava/lang/instrument/Instrumentation;Ljava/lang/String;)V+82
j Agent.lambda$premain$0(Ljava/lang/instrument/Instrumentation;Ljava/lang/String;)V+2
j Agent$$Lambda$14+0x0000000801002c00.run()V+8
j java.lang.Thread.runWith(Ljava/lang/Object;Ljava/lang/Runnable;)V+5 java.base@20.0.1
j java.lang.Thread.run()V+19 java.base@20.0.1
v ~StubRoutines::call_stub 0x00007f8d88138cc6
V [libjvm.so+0x8c9c85] JavaCalls::call_helper(JavaValue*, methodHandle const&, JavaCallArguments*, JavaThread*)+0x315
V [libjvm.so+0x8cb5f2] JavaCalls::call_virtual(JavaValue*, Handle, Klass*, Symbol*, Symbol*, JavaThread*)+0x1d2
V [libjvm.so+0x99debe] thread_entry(JavaThread*, JavaThread*)+0x8e
V [libjvm.so+0x8e1578] JavaThread::thread_main_inner() [clone .part.0]+0xb8
V [libjvm.so+0xf18736] Thread::call_run()+0xa6
V [libjvm.so+0xcae8d8] thread_native_entry(Thread*)+0xd8
Java frames: (J=compiled Java code, j=interpreted, Vv=VM code)
The lines VM_RedefineClasses::merge_cp_and_rewrite and ConstantPool::allocate points us towards the constant pools management during the retransform operation.
Discussions with the OpenJDK community also helped me diagnose what’s going on at the JVM level. Using logging of the JVM provides good insights.
I ran with -Xlog:redefine* and the end of the output just before the OOME is the following:
[2.565s][info][redefine,class,constantpool] old_cp_len=3871, scratch_cp_len=3871
[2.566s][info][redefine,class,constantpool] merge_cp_len=3873, index_map_len=2
[2.566s][info][redefine,class,load ] redefined name=MyClass, count=1920 (avail_mem=2193668K)
[2.566s][info][redefine,class,update ] adjust: name=MyClass
[2.567s][info][redefine,class,timer ] vm_op: all=1 prologue=1 doit=0
[2.567s][info][redefine,class,timer ] redefine_single_class: phase1=0 phase2=0
[2.567s][info][redefine,class,constantpool] old_cp_len=3873, scratch_cp_len=3873
[2.568s][info][redefine,class,constantpool] merge_cp_len=3875, index_map_len=2
[2.575s][info][redefine,class,load ] redefined name=MyClass, count=1921 (avail_mem=2192912K)
[2.575s][info][redefine,class,update ] adjust: name=MyClass
[2.576s][info][redefine,class,timer ] vm_op: all=8 prologue=7 doit=1
[2.576s][info][redefine,class,timer ] redefine_single_class: phase1=0 phase2=0
[2.585s][info][redefine,class,load,exceptions] merge_cp_and_rewrite exception: 'java/lang/OutOfMemoryError'
You will notice that the size of the constant pool (cp) used for retransforming the class is increasing linearly by 2 entries (old_cp_len) for each operation until… boom!
To help me navigate through the JVM code, I even profiled the reproducer to have a grasp of what’s going on here:
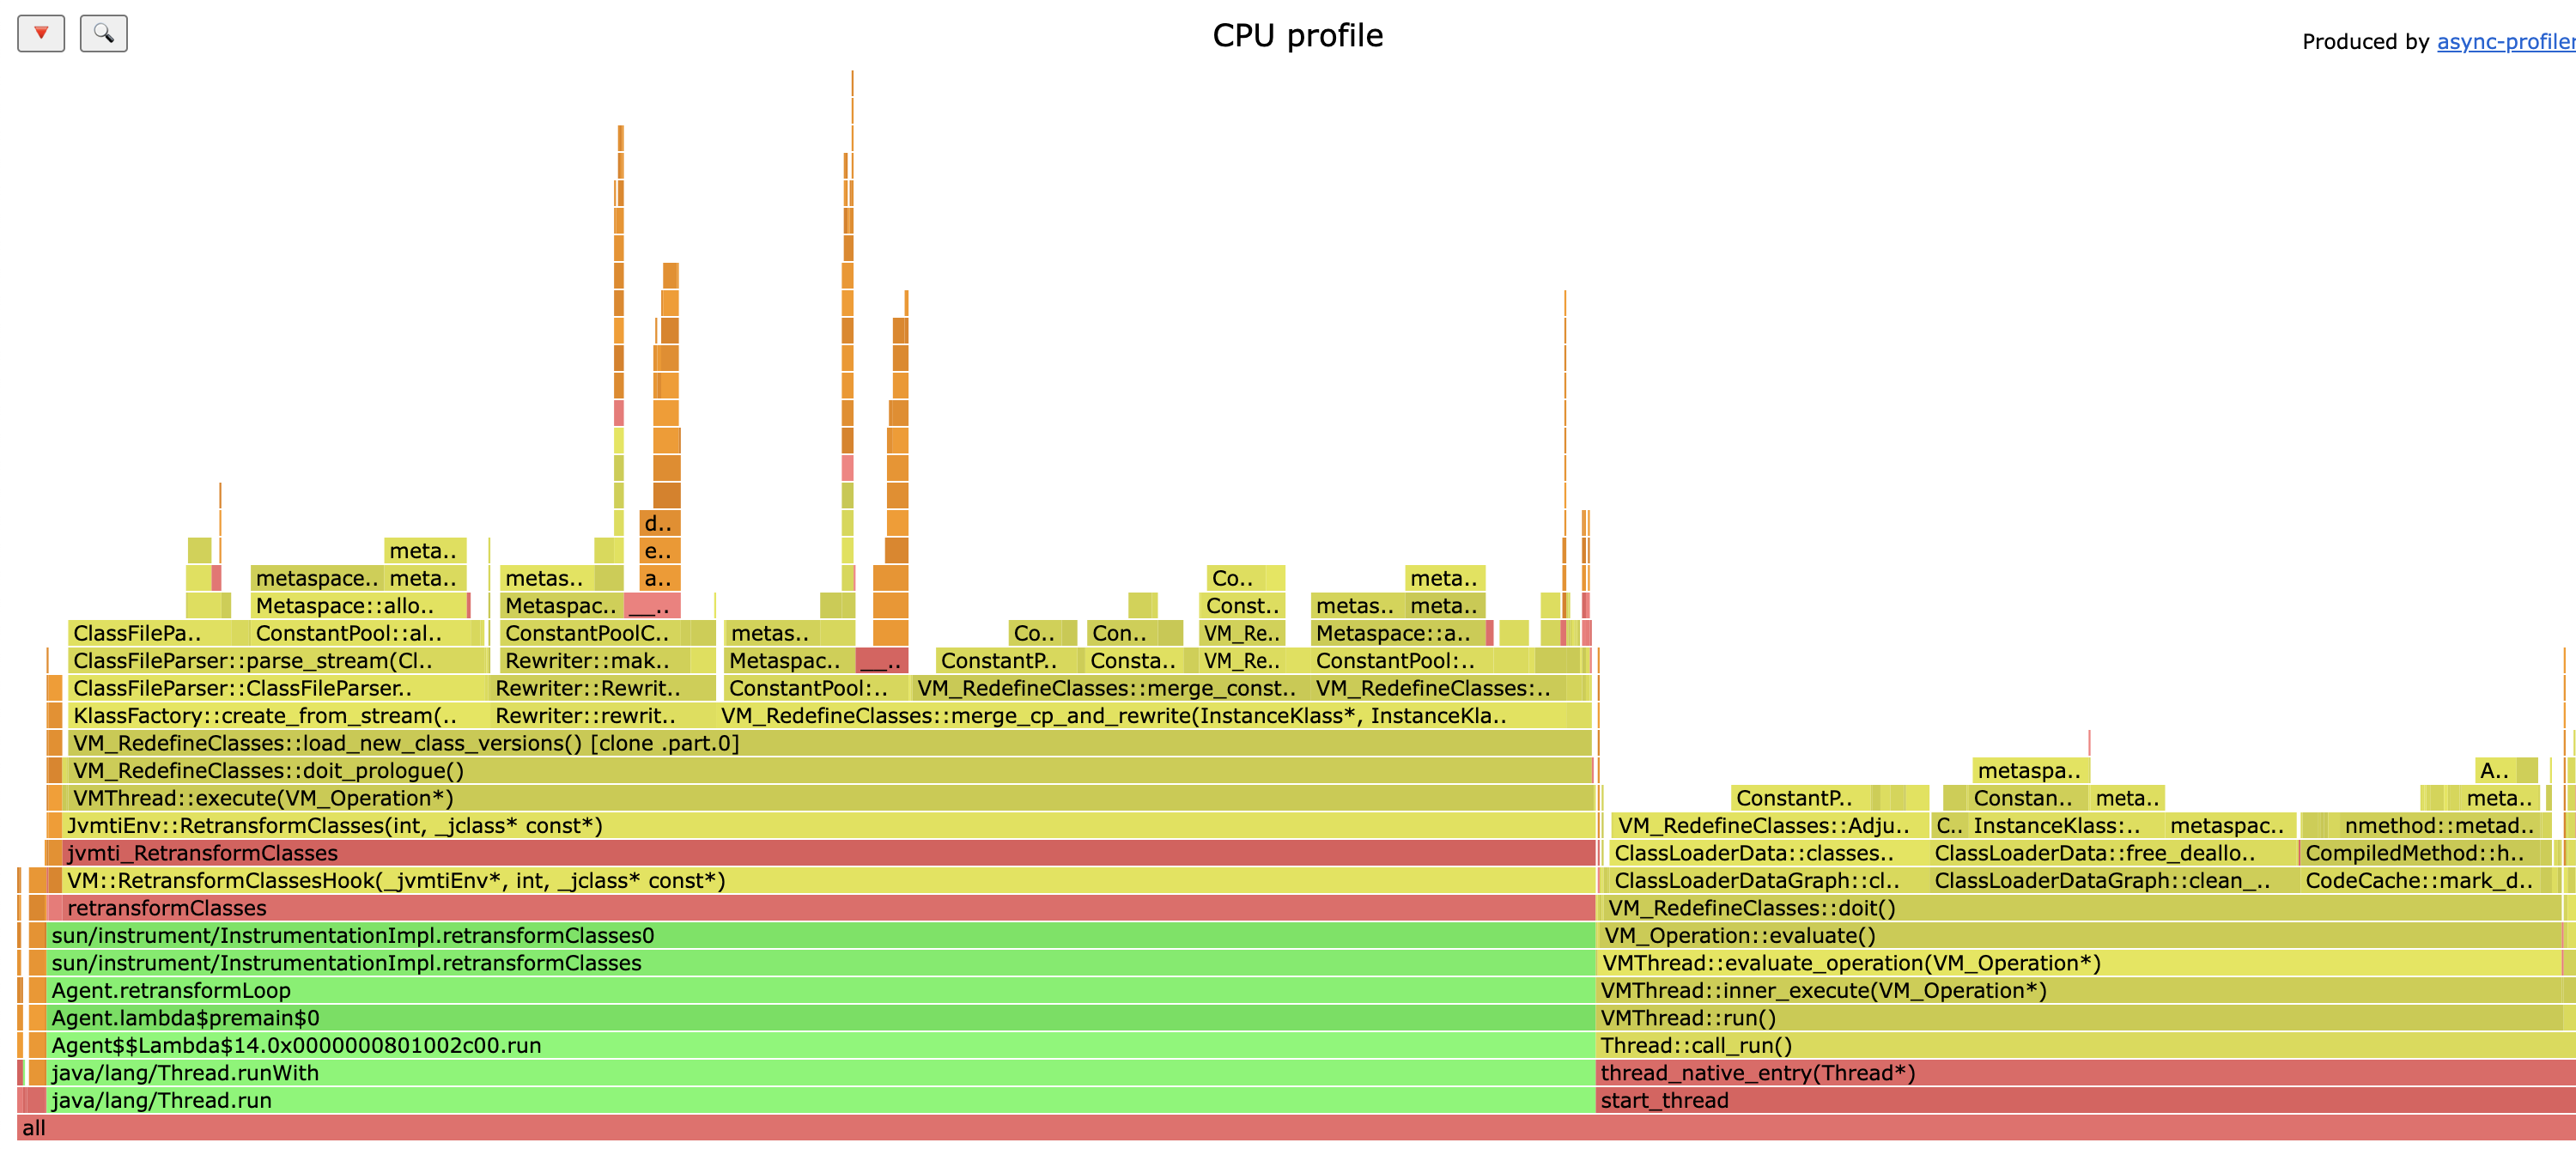
In this profile it seems more obvious that the retransform operation is done at safepoint and under Stop-The-World of application threads.
With the logs and the profile, we can correlate to find which method is doing the allocation that can leak to Metaspace.
The bug
To really understand the bug, I need to explain a few things first:
What is a constant pool?
Each classfile contains a dictionary called constant pool that refers classe, method, field references and strings that are used by the bytecode.
Example:
Constant pool:
   #1 = Methodref          #4.#21         // java/lang/Object."<init>":()V
   #2 = Methodref          #22.#23        // java/lang/Integer.parseInt:(Ljava/lang/String;)I
   #3 = Class              #24            // CapturedSnapshot01
   #4 = Class              #25            // java/lang/Object
   #5 = Utf8               <init>
   #6 = Utf8               ()V
   #7 = Utf8               Code
   #8 = Utf8               LineNumberTable
   #9 = Utf8               LocalVariableTable
  #10 = Utf8               this
  #11 = Utf8               LCapturedSnapshot01;
  #12 = Utf8               main
  #13 = Utf8               (Ljava/lang/String;)I
  #14 = Utf8               arg
  #15 = Utf8               Ljava/lang/String;
  #16 = Utf8               var1
  #17 = Utf8               I
  #18 = Utf8               StackMapTable
  #19 = Utf8               SourceFile
  #20 = Utf8               CapturedSnapshot01.java
  #21 = NameAndType        #5:#6          // "<init>":()V
  #22 = Class              #26            // java/lang/Integer
  #23 = NameAndType        #27:#13        // parseInt:(Ljava/lang/String;)I
  #24 = Utf8               CapturedSnapshot01
  #25 = Utf8               java/lang/Object
  #26 = Utf8               java/lang/Integer
  #27 = Utf8               parseInt
When you want to load a constant string into the stack to call a method, the bytecode contains an instruction ldc followed by the index inside the constant pool:
ldc #7
It allows sharing this strings with other bytecode instructions and having a compact representation of the bytecode.
Merging constant pools
When retransforming a class, the bytecode may have changed so the constants may have changed as well. We need to adjust entries: create new ones and remove the unneeded. This is done by copying the original ones then doing a merge. As entries can reference each other, loading the constant pool also involves a pass for resolution. In the example above, entry #1
#1 = Methodref #4.#21
references entry #4 and #21, so we need to resolve it to get all the information needed when a bytecode references this #1 entry like invoking this method.
For its internal representation the JVM is using some specific values to indicate the state of the constant pool entry resolved/unresolved.
If we look at the stacktrace from where the Metaspace OOM happens, we can see that
...
V [libjvm.so+0xae518c] VM_RedefineClasses::merge_cp_and_rewrite(InstanceKlass*, InstanceKlass*, JavaThread*)+0x4c
...
cp stands for constant pool. Looks like a good entry point to navigate into the code and understand the process involved.
To understand the process of merging the constant pools, you just have to read the following comment found here. This is like a blog post:). To sum up, the merging process assumes all entries are in an unresolved state to be able to be compared one by one.
In our case, we are referencing with a Methodref the Throwable class, and David Holmes from Oracle pointed us to the class verifier, in ClassVerifier::verify_exception_handler_table:
      VerificationType throwable =
        VerificationType::reference_type(vmSymbols::java_lang_Throwable());
      // If the catch type is Throwable pre-resolve it now as the assignable check won't
      // do that, and we need to avoid a runtime resolution in case we are trying to
      // catch OutOfMemoryError.
      if (cp->klass_name_at(catch_type_index) == vmSymbols::java_lang_Throwable()) {
        cp->klass_at(catch_type_index, CHECK);
      }
Basically, the verifier will pre-resolve a Throwable class in the constant pool in case of a caught OutOfMemoryError. In that case, we don’t want to do a resolution that could fail because of new potential allocations…
Throwable is therefore the only class resolved into the constant pool, but with the process described above, it means the entry comparison will fail and generate new entries in the merged constant pool, allocating new buffers, and each time for every retransformation… that’s the leak!
The fix
After some discussions, especially with Coleen Phillimore about the bug and attempts to fix it, she directed me toward a simple fix:
make sure all entries in the constant pool that are related to Class are marked as unresolved even if this is a Throwable class during the comparison/merge.
You can find the PR merged here.
Conclusion
This long standing memory leak was an interesting journey during all phases: diagnosing, reproducing, understanding and finally fixing the issue. The OpenJDK team was also very helpful to understand and prepare the fix.
References
- Report of the leak in OpenJDK mailing list
- Ticket in JDK Bug System
- Pull Request in OpenJDK repository
- Redefine/Retranform process, big comment in source code
- What is Metaspace by Thomas Stuefe
- Metaspace Architecture by Thomas Stuefe
Thanks to Christophe Nasarre & Marcus Hirt for the review.