22 May 2020
7 mins readStartup, containers & Tiered Compilation
Introduction
Since the introduction of containers, the way we are running JVM applications has changed a lot. In the same time, microservices architecture rises and the usage of container orchestration like Mesos or Kubernetes has transformed our approach of deployment. With all of that, I end up encountering people configuring a container with less than 1 core. Yes, with docker, for example, we can specify that the container will run with a fraction of a core (called millicores in Kubernetes). The kernel is dealing with that using cpu scheduling quota (see CFS bandwidth). If it could make sense to put 1.5 or 2.5 on an already multi-core machine, putting less than a core has different implications…
Tiered Compilation
Since JDK 8, Tiered Compilation was introduced and made by default. It means that the 2 JIT compilers (C1 & C2) are used in combination. Before that, there were those 2 JITs, but you had to choose between the 2. C1 was made for client applications, with the assumption that desktop machines (at that time) had one core. C1 is focusing on startup time and reaching native performance quickly. C2 was made for server applications, with at least 2 cores (server-class machine), focused on reaching peak performance but with less time constraints.
Nowadays, with Tiered Compilation we can benefit from both JITs at the same time. So first, the JVM JIT compiles with C1 to quickly reach native code, but with profiling and at some point, C2 kicks-in and it recompiles for more aggressive and time consuming optimizations.
Here is a description of the different levels of compilation:
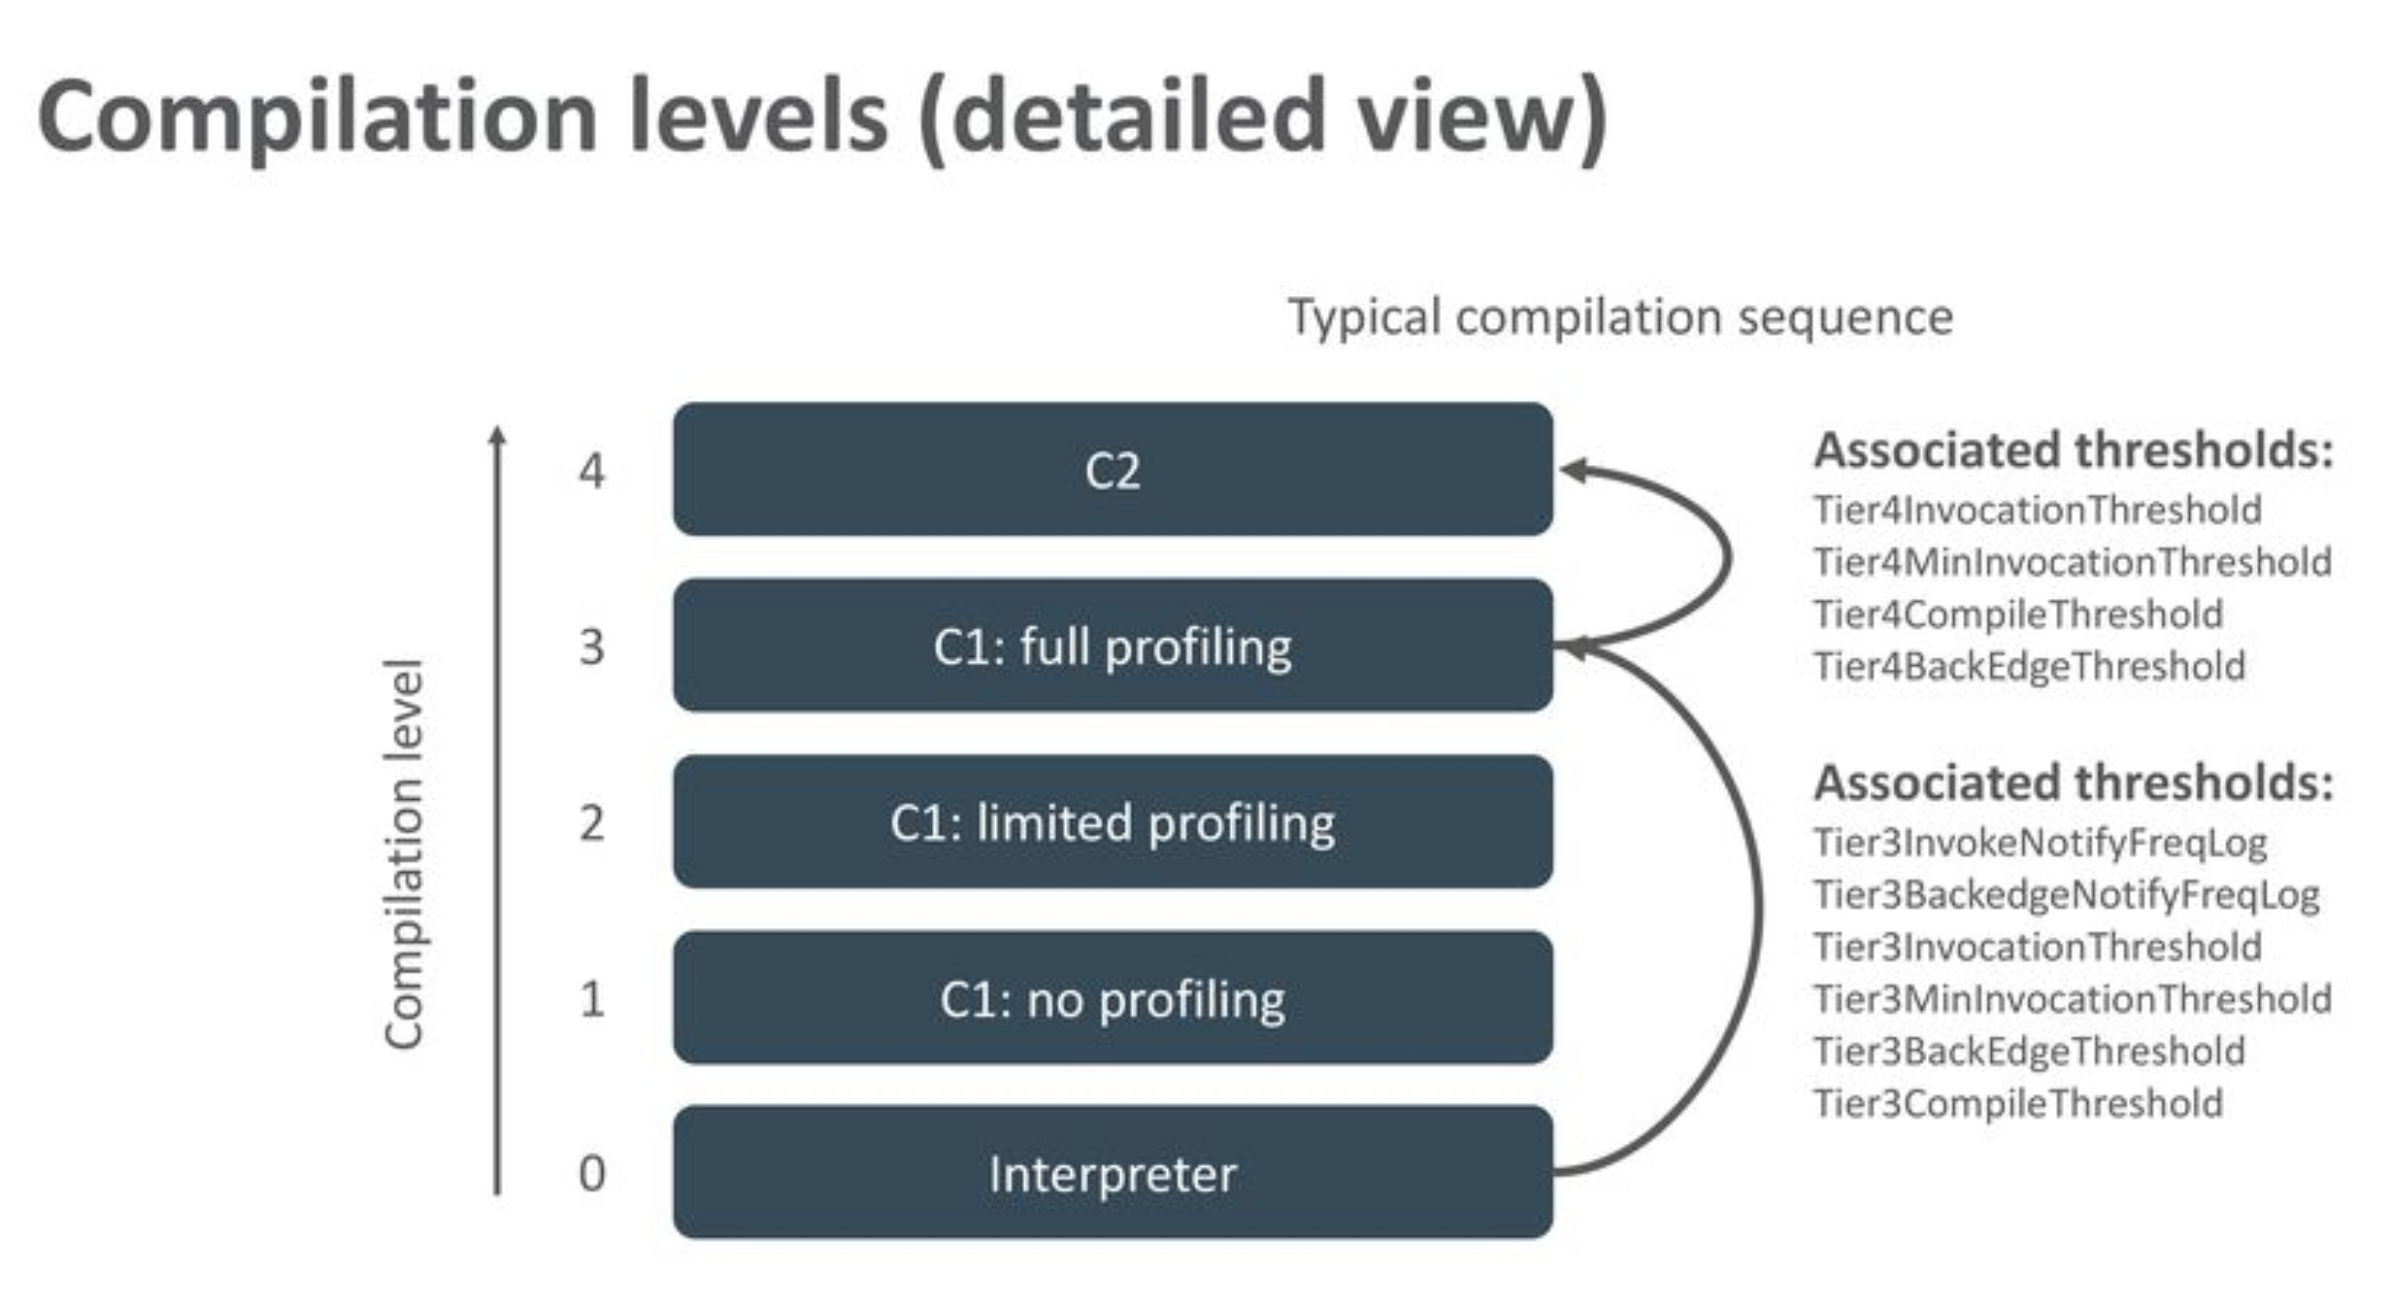
The nominal path for most of the methods are level 0 (Interpretation), level 3 (C1 + Full Profiling) and level 4 (C2) But things can change like:
- If too many methods are queued for level 4 compilation, some are sent to level 2.
- If methods are trivial (small, nothing to profile) they are directly compiled at level 1 and stop here.
But what you need to keep in mind is that the process is dynamic (thresholds are also adjusted on the fly).
Also note that the JIT uses some threads in the background to perform the compilation. The option CICompilerCount allow you to specify this number, but by default in Tiered Compilation mode there is 2 threads (1 per JIT Compiler):
$ java -XX:+PrintFlagsFinal -version | grep CICompilerCount
     intx CICompilerCount                          := 2                                   {product}
     bool CICompilerCountPerCPU                     = true                                {product}
Measuring startup time
Most of the compilations happen at startup time, let’s take a classic application like Spring PetClinic.
Here the Dockerfile:
FROM azul/zulu-openjdk:8
RUN apt-get update && apt-get install -y git
RUN git clone https://github.com/spring-projects/spring-petclinic.git
RUN cd spring-petclinic && ./mvnw package
CMD ["java", "-jar", "/spring-petclinic/target/spring-petclinic-2.3.0.BUILD-SNAPSHOT.jar"]
Build the image spring-petclinic:
$ docker build --tag spring-petclinic .
Let’s run it with 4 cores of my intel i7-8569U. The application at the end of the startup displays:
Started PetClinicApplication in 12.059 seconds (JVM running for 12.918)
Now let’s run it with different cpus from docker:
docker run --cpus=<n> -ti spring-petclinic
| Cpus | JVM startup time (s) |
|---|---|
| 4 | 12.918 |
| 2 | 14.444 |
| 1 | 35.795 |
| 0.8 | 50.151 |
| 0.4 | 118.462 |
| 0.2 | 297.698 |
From 1 cpu, startup time begins to suffer dramatically.
Adding this in the main method will help us quantify the JIT time spent for our startup:
System.out.println("Total Compilation time: " + ManagementFactory.getCompilationMXBean().getTotalCompilationTime() + "ms");
Results with 4 cpus and therefore with C1 + C2:
Total Compilation time: 17718ms
Let’s measure with only C1 by using -XX:TieredStopAtLevel=1
Total Compilation time: 1261ms
More than 10x difference! But why such a difference? How is this compilation time distributed?
Measuring JIT Compilation time
I have used the Azul Zulu 8 distribution for one reason: it includes JDK Flight Recorder (JFR), so we can record compilation events to have more information about the JIT.
Each JDK distribution including JFR, provides by default 2 settings: default & profiling. Those settings can be found in
<base_dir>/lib/jfr directory.
I have duplicated the default.jfc file and edited as follow:
    <event name="jdk.Compilation">
      <setting name="enabled" control="compiler-enabled">true</setting>
      <setting name="threshold" control="compiler-compilation-threshold">0 ms</setting>
    </event>
I have reduced the threshold to 0 ms instead of 1000 ms to report information about all compiled methods.
Then, I have launched the application as follow:
java -XX:StartFlightRecording=dumponexit=true,filename=C1C2.jfr,settings=compile -XX:TieredStopAtLevel=4 -jar target/spring-petclinic-2.3.0.BUILD-SNAPSHOT.jar
to record Tiered Compilation C1+C2, and:
java -XX:StartFlightRecording=dumponexit=true,filename=C1.jfr,settings=compile -XX:TieredStopAtLevel=1 -jar target/spring-petclinic-2.3.0.BUILD-SNAPSHOT.jar
to record C1 only.
I have opened both files into JDK Mission Control:
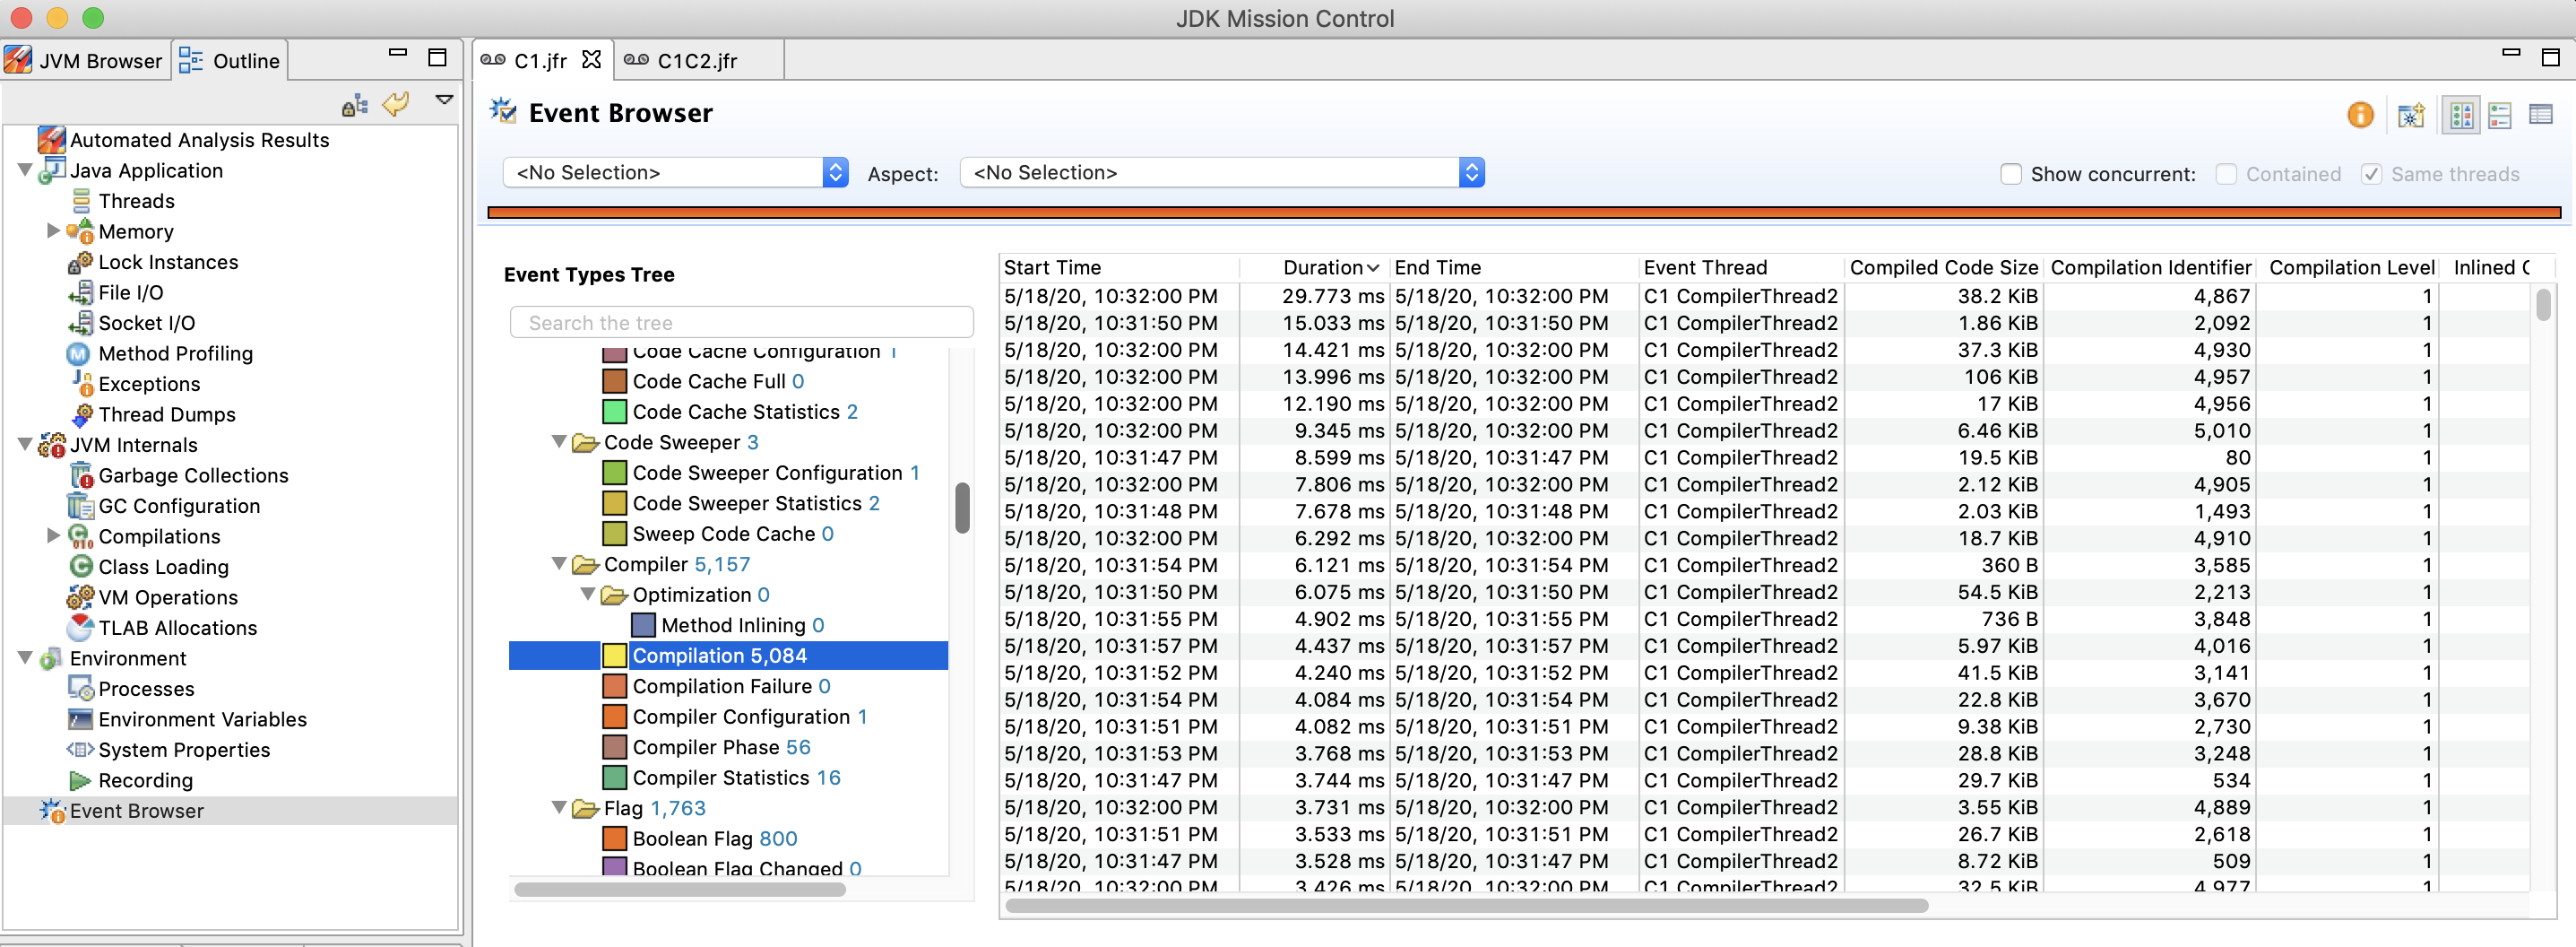 You can have a look at the compilation information in the
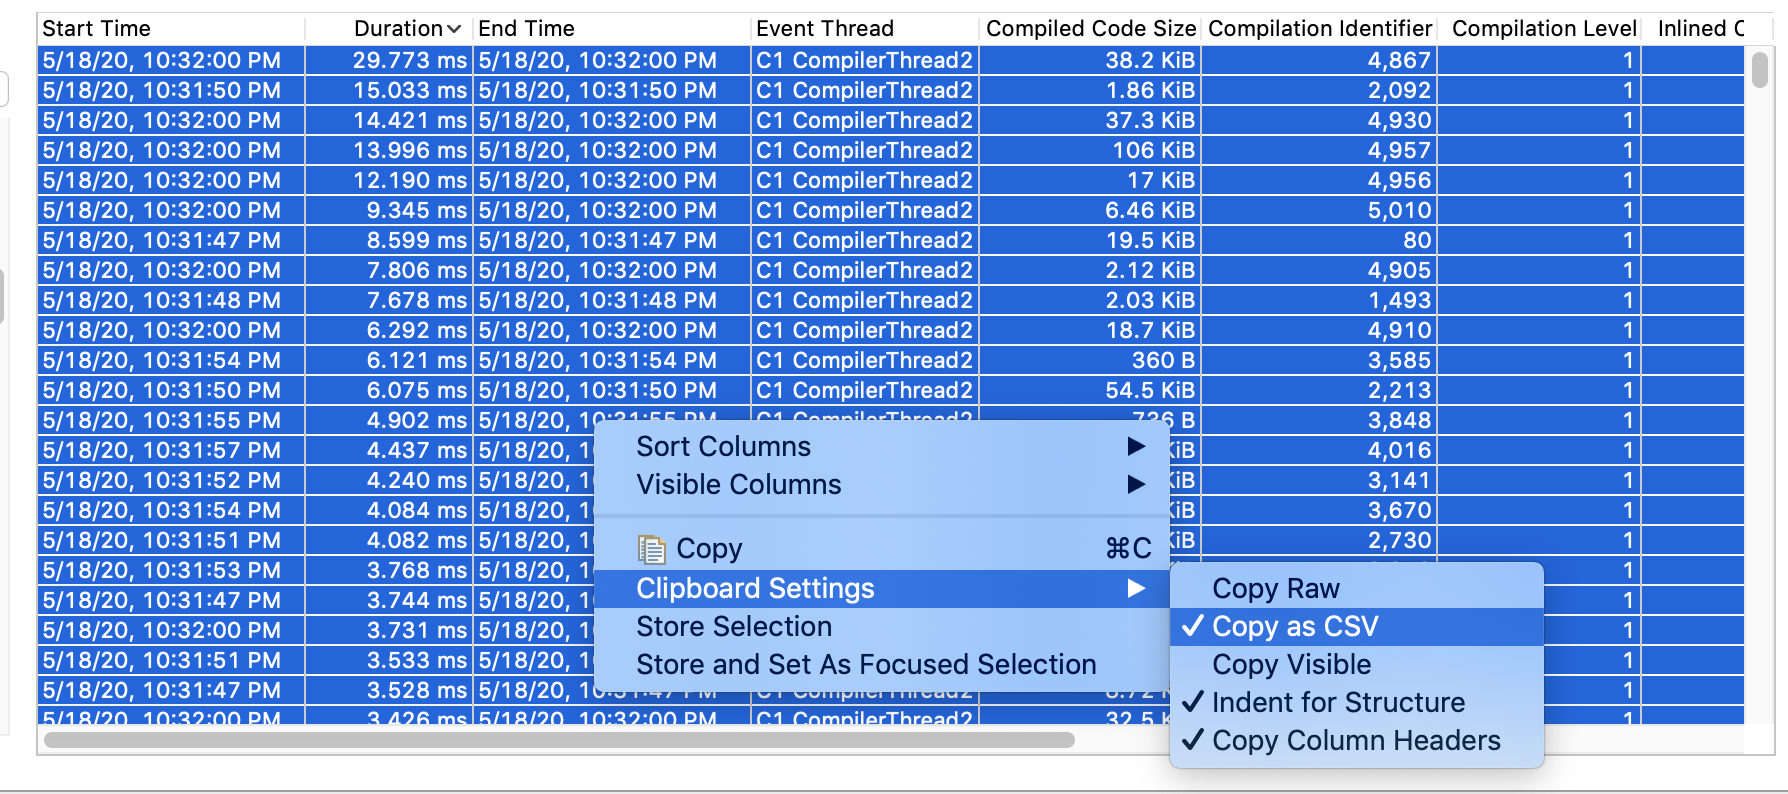
 Event Browser tree entry on the left, and then choose Compilation in Event types Tree in the middle. You can then export the list of events by selecting all the lines (CTRL+A) and right click on the selection to select Clipboard settings -> Copy as CSV and then Copy. You can now paste this into a new file.
Here some statistics:
| C1+C2 | C1 only | |
|---|---|---|
| # compiled methods | 6,117 | 5,084 |
| # C1 compiled methods | 5,254 | 5,084 |
| # C2 compiled methods | 863 | 0 |
| Total Time (ms) | 21,678 | 1,234 |
| Total Time in C1 (ms) | 2,071 | 1,234 |
| Total Time in C2 (ms) | 19,607 | 0 |
| # methods comp. time > 1ms | 950 | 154 |
| # methods comp. time > 10ms | 201 | 5 |
| # methods comp. time > 100ms | 54 | 0 |
| Max compilation time (ms) | 738 | 29 |
What we can see is C2 taking a very long time to compile a method. We can sum up those statistics with this: 863 methods compiled with C2 took 19s in total to compile while 5,000+ methods compiled with C1 took 1.2s
The time consumed by C2 threads is part of the quota of CPU allocated for your container. C2 in total consumes more CPU than the time to startup (App startup time 12s, C2 time 19s).
Let’s run our PetClinic application with only C1:
| Cpus | JVM startup time (s) | % diff |
|---|---|---|
| 4 | 14.465 | +12% |
| 2 | 14.097 | -2% |
| 1 | 21.208 | -40% |
| 0.8 | 29.3 | -41% |
| 0.4 | 71.45 | -40% |
| 0.2 | 176.105 | -40% |
Conclusion
By default, Tiered Compilation provides background compilation using 2 threads, 1 for C1 and the other for C2. But as we were able to measure, compilation time for C2, is at least 10 times longer than C1. This has real implications on CPU time consumed, especially at startup time.
Using containers with CPU quota restriction with only 1 core or less will clearly impact your startup and if this phase is critical for you (time to respond at health checks for example), you should consider using -XX:TieredStopAtLevel=1. Regarding peak performance, in my opinion, if you have already given less than 1 core to your application instance, I don’t think the level of C2 optimizations will bring a big difference. Up to you to measure with your specific workload if the latency/throughput is affected by using only C1.
References
- TieredCompilation in depth:
- Chris Newland’s VM Options Explorer
Thanks to Marcus Hirt for the review