13 Jul 2015
8 mins readNotify… oh, wait! I have a signal.
Introduction
When you want to pipeline, delegate some task asynchronously or simply synchronize 2 threads, you usually end up using wait/notify couple (or even await/signal, depending on your taste).
But what is the cost or the overhead for this kind of pattern?
Under the hood
What happening when we are using wait/notify couple?
I simplify here to this couple, as the other (await/signal) calls the same set of underlying methods:
| Linux | Windows | |
|---|---|---|
Object.notify |
pthread_cond_signal |
SetEvent |
Object.wait |
pthread_cond_timedwait |
WaitForSingleObject |
Basically we are performing system calls. For Object.wait we ask the OS scheduler to move the current thread to the wait queue
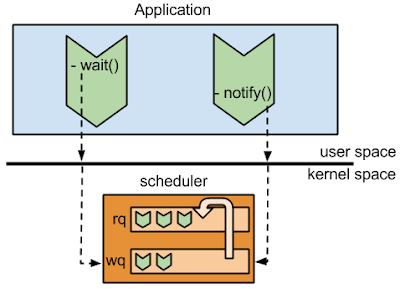
For Object.notify, we ask the scheduler (via futexes on Linux) to move one of the waiting threads from the wait queue to the run queue to be scheduled when possible.
Just a quick remark about system calls: contrary to the common belief, system calls do not imply context switches. It depends on the kernel implementation. On Linux there is no context switch unless the system call implementation requires it like for IO. In the case of pthread_cond_signal, there is no context switches involved.
Knowing that, what is the cost of calling notify for a producer thread ?
Measure, don’t guess!
Why not building a micro-benchmark ? Because I do not care about average latency, I care about outliers, spikes. How it behaves for 50, 90, 95, 99, 99.9 % of the time. What may be the maximum I can observe? Let’s measure it with HdrHistorgram from Gil Tene and the following code:
import java.io.FileOutputStream;
import java.io.PrintStream;
import java.util.Arrays;
import java.util.concurrent.locks.LockSupport;
import org.HdrHistogram.AtomicHistogram;
import org.HdrHistogram.HistogramData;

public class TestNotify
{
    static final int WARMUP_COUNT = 10000;
    static final AtomicHistogram hist = new AtomicHistogram(10*1000*1000*1000L, 5);

    public static void main(String[] args) throws Exception
    {
        final int THREAD_COUNT = Integer.parseInt(args[0]);
	    final int LOOP_COUNT = Integer.parseInt(args[1]);

        FlushingThread[] flushingThreads = new FlushingThread[THREAD_COUNT];
        for (int i = 0; i < flushingThreads.length; i++)
        {
            flushingThreads[i] = new FlushingThread();
            flushingThreads[i].start();
        }

        CriticalThread[] criticalThreads = new CriticalThread[THREAD_COUNT];
        for (int i = 0; i < criticalThreads.length; i++)
        {
            criticalThreads[i] = new CriticalThread(flushingThreads[i], LOOP_COUNT);
            criticalThreads[i].start();
        }
        for (int i = 0; i < criticalThreads.length; i++)
        {
            criticalThreads[i].join();
            flushingThreads[i].interrupt();
            flushingThreads[i].join();
        }
        HistogramData histogramData = hist.getHistogramData();
        System.out.println("=======");
        System.out.println("count: " + histogramData.getTotalCount());
        System.out.println("min: " + histogramData.getMinValue());
        System.out.println("max: " + histogramData.getMaxValue());
        System.out.println("mean: " + histogramData.getMean());
        System.out.println("50%: " + histogramData.getValueAtPercentile(50));
        System.out.println("90%: " + histogramData.getValueAtPercentile(90));
        System.out.println("95%: " + histogramData.getValueAtPercentile(95));
        System.out.println("99%: " + histogramData.getValueAtPercentile(99));
        System.out.println("99.9%: " + histogramData.getValueAtPercentile(99.9));
        FileOutputStream fos = new FileOutputStream("hist.txt");
        try
        {
            histogramData.outputPercentileDistribution(new PrintStream(fos), 1000.0);
        }
        finally
        {
            fos.close();
        }
    }

    private static class CriticalThread extends Thread
    {
        byte[] buffer = new byte[4096];
        FlushingThread flushingThread;
        int loopCount;

        public CriticalThread(FlushingThread flushingThread, int loopCount)
        {
            this.flushingThread = flushingThread;
            this.loopCount = loopCount;
        }

        @Override
        public void run()
        {

            for (int i = 0; i < WARMUP_COUNT; i ++)
            {
                process(i, 0);
            }
            for (int i = WARMUP_COUNT; i < WARMUP_COUNT+loopCount; i++)
            {
                process(i, 1);
            }
        }

        private void process(int i, long waitTimeMs)
        {
            Arrays.fill(buffer, (byte)i);
            flushingThread.flush(i);
            LockSupport.parkNanos(waitTimeMs*1000*1000);
        }
    }

    private static class FlushingThread extends Thread
    {
        boolean mustFlush;
        Object flushLock = new Object();

        @Override
        public void run()
        {
            try
            {
                while (!isInterrupted())
                {
                    synchronized (flushLock)
                    {
                        while (!mustFlush)
                        {
                            flushLock.wait();
                        }
                        mustFlush = false;
                    }
                    LockSupport.parkNanos(10*1000);
                }
            }
            catch (InterruptedException ex)
            {

            }
            catch (Exception ex)
            {
                ex.printStackTrace();
            }
        }

        public void flush(int i)
        {
            long start = System.nanoTime();
            synchronized (flushLock)
            {
                mustFlush = true;
                flushLock.notify();
            }
            long stop = System.nanoTime();
	        if (i >= WARMUP_COUNT)
		        hist.recordValue(stop-start);
        }
    }
}
This code basically creates n pairs of threads: one (critical) which trying to notify the second (flushing) that data are available to be processed (or flushed).
I run this code with following parameters 16 1000. It means that we have 16 pairs of threads that doing wait/notify.
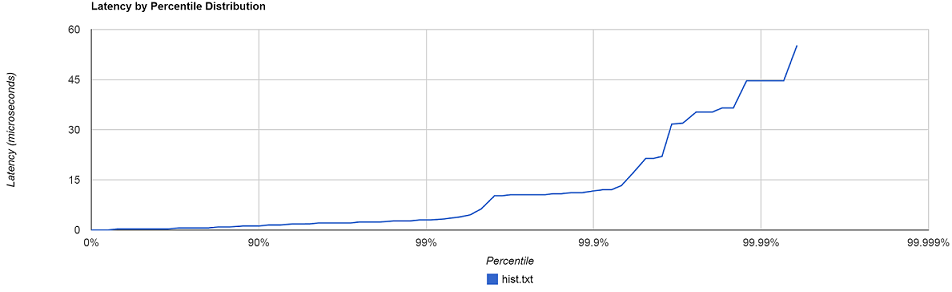
Results on Windows (ns):
count: 16000
min: 0
max: 55243
mean: 549.5238125
50%: 302
90%: 1208
95%: 1812
99%: 3019
99.9%: 11472
Results on Linux (ns):
count: 16000
min: 69
max: 20906
mean: 1535.5181875
50%: 1532
90%: 1790
95%: 1888
99%: 2056
99.9%: 3175
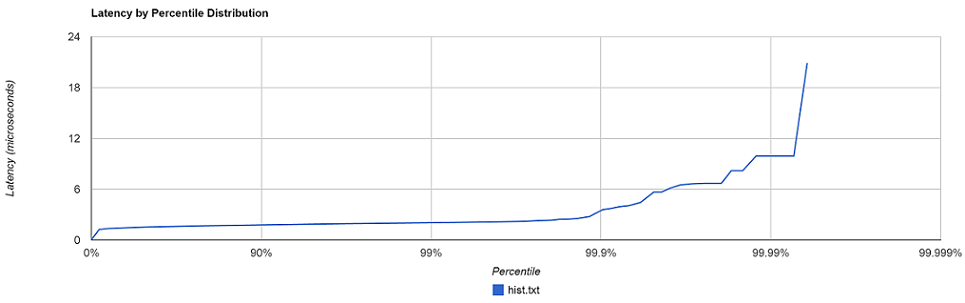
So most of the time we can observe couple of microseconds for a call to notify. But in some cases we can reach 50us! For Low Latency systems it can be an issue and a source of outliers.
Now, if we push a little our test program to use 256 pairs of threads we end up with the following results:
Results on Windows (ns):
count: 256000
min: 0
max: 1611088
mean: 442.25016015625
50%: 302
90%: 907
95%: 1208
99%: 1811
99.9%: 2717
Results on Linux (ns):
count: 256000
min: 68
max: 1590240
mean: 1883.61266015625
50%: 1645
90%: 2367
95%: 2714
99%: 7762
99.9%: 15230
A notify call can take 1.6ms!
Even though there is no contention in this code per se, there is another kind of contention that happens in the kernel. Scheduler needs to arbitrate which thread can be run. Having 256 threads that trying to wake up their partner thread put a lot of pressure on the scheduler which become a bottleneck here.
Conclusion
Signaling can be a source of outliers not because we have contention on executing code between threads but because the OS scheduler needs to arbitrate among those threads, responding to wake up requests.
References
- Futex are tricky U. Drepper: http://www.akkadia.org/drepper/futex.pdf
- http://en.wikipedia.org/wiki/System_call#Processor_mode_and_context_switching