23 May 2014
7 mins readMeasuring contention on locks
Locks is one of the major bottleneck in scalability for your code. Lock-Free structures offer an alternative to your lock usage. However it is sometimes more difficult to use or to integrate into your existing code. Before rushing into this specific approach, it would be interesting to determine which part of your locking code would really benefit from this. Locks become a bottleneck if more than one thread tries to acquire them and needs to wait for a release. This is contention. Measuring this contention will help us to pinpoint which locks need to be improved.
You see in this Java world there are two kinds of locks. Those with synchronized blocks, and those which use java.util.concurrent.Lock. The first ones are directly handled by the JVM with the help of a specific byte code (monitorenter & monitorexit). With those, JVM provides, via JVMTI, some events that can be used by native agents to get information about synchronized blocks: MonitorContendedEnter & MonitorContentedEntered.
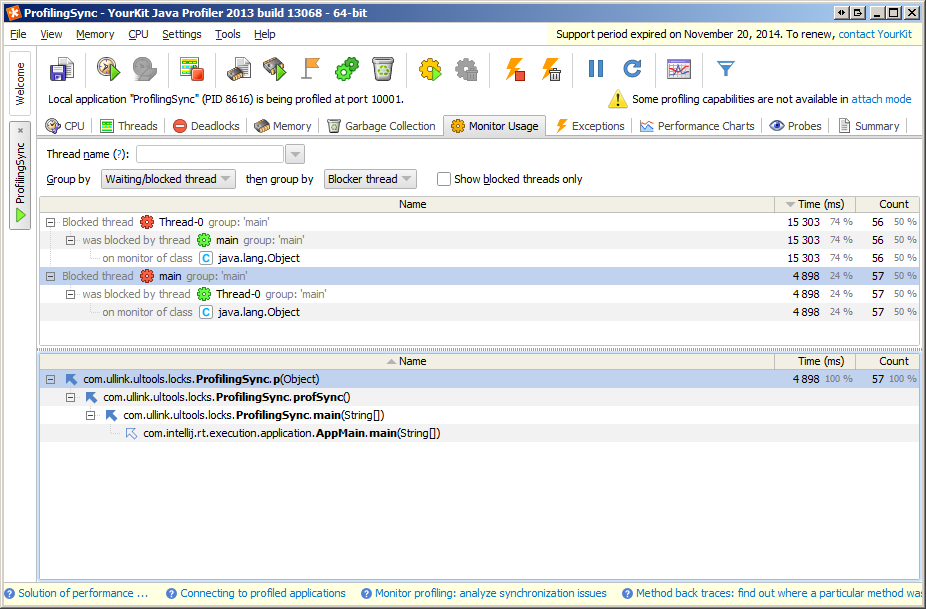
Profilers like YourKit exploit this information to provide contention profiling.
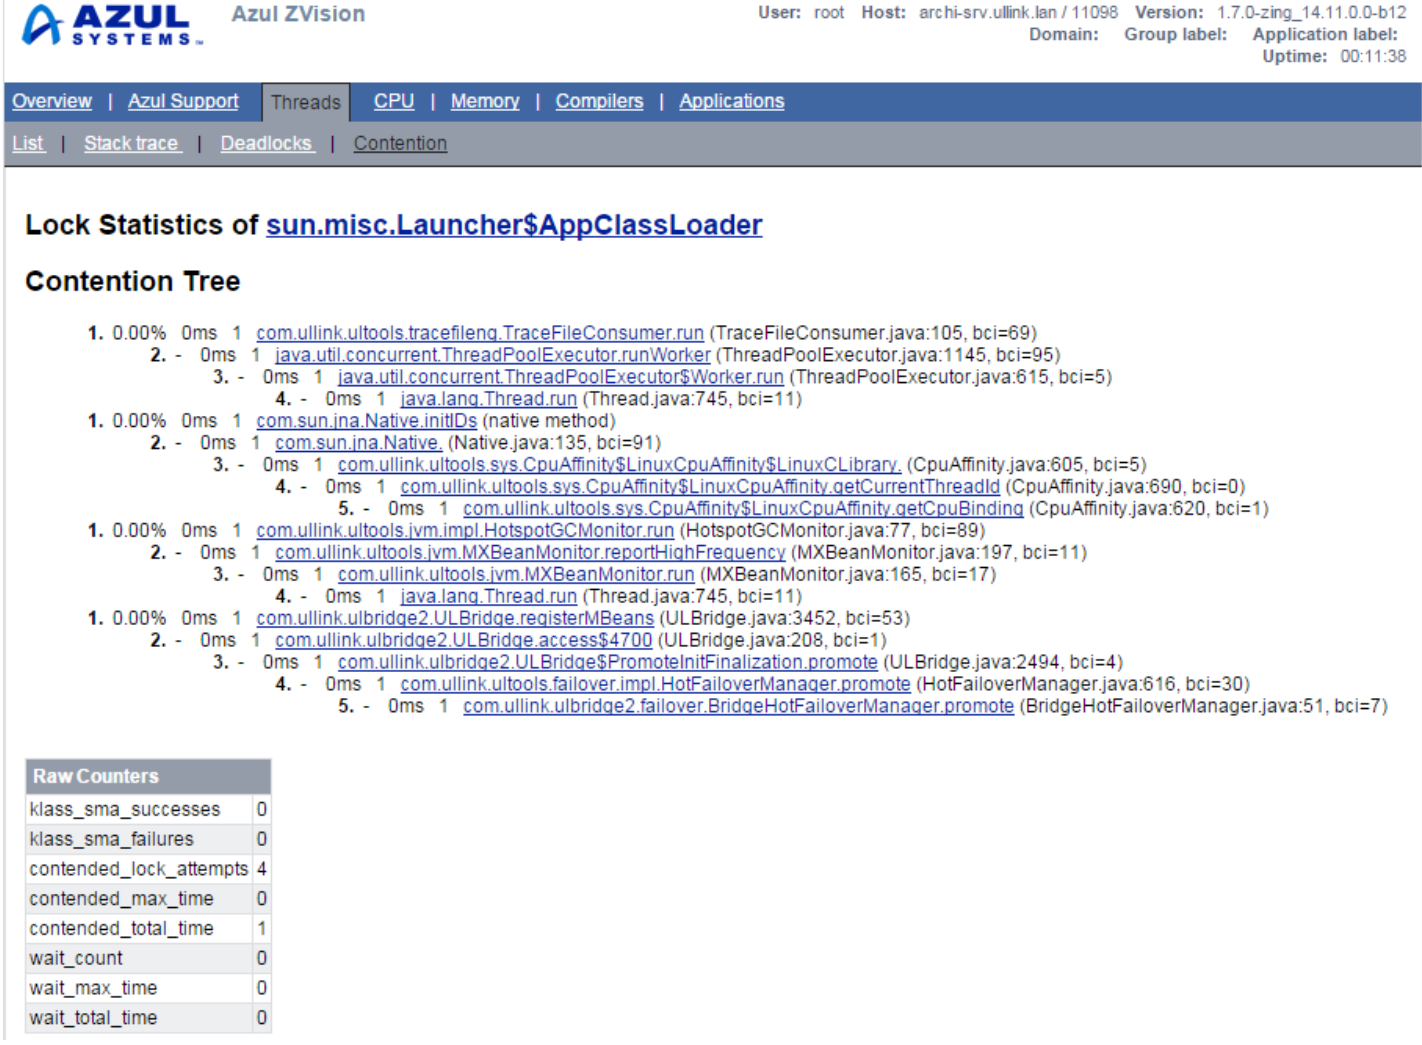
Azul Systems provides with their Zing JVM a tool named ZVision to also profile the synchronized blocks:
But what about j.u.c.Lock?
Here, this is trickier: j.u.c.Lock is not handled by the JVM. It is part of the JDK classes like any regular library. No special treatment. Hence, no special information about them.
YourKit is not able to profile them. However, another profiler which is able to profile j.u.c.Lock exists: JProfiler.
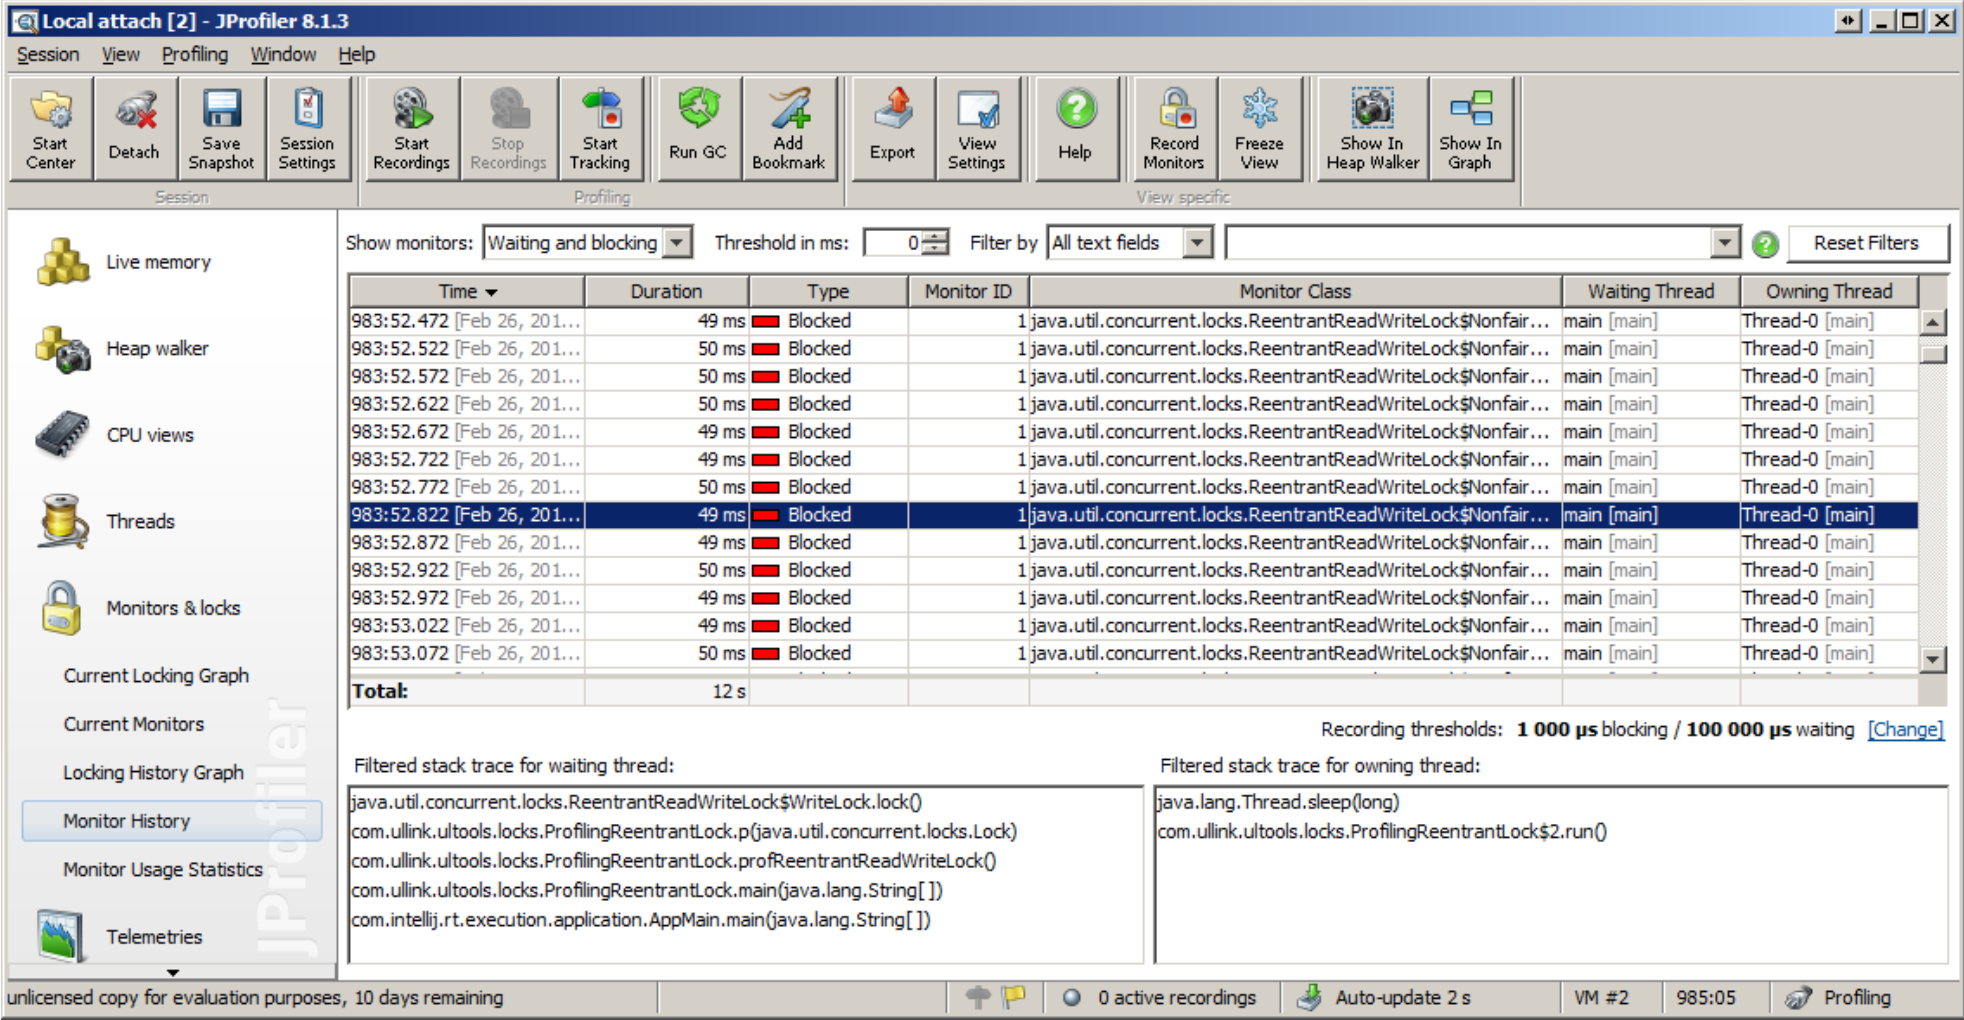
I suppose it uses instrumentation to insert callbacks when j.u.c.Lock classes are used. Profile information seems precise with callstacks. It helps to identify which locks are effectively in contention.
I have also found an article describing jucProfiler, a tool created by an IBM team.
Before finding those 2 last tools, I made a very light and quick j.u.c.Lock profiler on my own. The technique is simple and I will describe it below. Full code available on GitHub.
The goal was to profile existing code using j.u.c.Locks. The plan wasn’t to create any wrapper around them or any subtype, but to intercept the actual classes. I copied the JDK classes and kept them in the same package.
I have identified in the code where the lock fails to be acquired. It means in those cases there is a contention with another thread which already holds the current lock.
Here is an extract from ReentrantLock:
static final class NonfairSync extends Sync {

        final void lock() {
            if (compareAndSetState(0, 1))
                setExclusiveOwnerThread(Thread.currentThread());
            else
            {
                contended++;
                acquire(1);
            }
        }
I incremented a contention field to keep track of the fail attempts. No need to have an atomic counter for this. If some contended locks are not precisely reported, it is not a big deal.
Each lock instance is identified at the construction by a unique ID and a callstack, stored into a global static map.
static Map<ReentrantLock, String> locks = Collections.synchronizedMap(new LinkedHashMap<ReentrantLock, String>());
static AtomicInteger lockIdGen = new AtomicInteger(0);
static ConcurrentLinkedQueue<LockInfo> queue = new ConcurrentLinkedQueue<LockInfo>();

static class LockInfo
{
    public final String id;
    public final ReentrantLock lock;
    public final StackTraceElement[] stack;

    LockInfo(String id, ReentrantLock lock, StackTraceElement[] stack)
    {
        this.id = id;
        this.lock = lock;
        this.stack = stack;
    }
}


public ReentrantLock() {
    String id = String.valueOf(lockIdGen.getAndIncrement());
    queue.offer(new LockInfo(id, this, Thread.currentThread().getStackTrace()));
    locks.put(this, id);
    sync = new NonfairSync();
}
When you want to report the statistics about lock contention, you can traverse the map and print the information about each lock including the number of contentions detected.
File statsFile = new File("./ReentrantLockStats.txt");
System.out.println("Creating "+statsFile.getAbsolutePath());
BufferedWriter writer = new BufferedWriter(new FileWriter(statsFile));
try
{
    while (!isInterrupted())
    {
        try
        {
            Date now = new Date();
            SimpleDateFormat sdf = new SimpleDateFormat("yyyy-MM-dd HH:mm:ss.SSS");
            StringBuilder sb = new StringBuilder();
            sb.append(sdf.format(now)).append(" ");
            LockInfo lockInfo;
            while ((lockInfo = queue.poll()) != null)
            {
                sb.append(System.getProperty("line.separator"));
                sb.append("creating lock ").append(lockInfo.id).append(": ");
                for (int i = 2; i < lockInfo.stack.length; i++)
                    sb.append(lockInfo.stack[i]).append(", ");
            }
            synchronized (locks)
            {
                for (Map.Entry<ReentrantLock, String> entry : locks.entrySet())
                {
                    ReentrantLock reentrantLock = entry.getKey();
                    String id = entry.getValue();
                    int count = reentrantLock.getContentedCount();
                    if (count > 0)
                        sb.append(id + "=" + count + ", ");
                }
            }
            writer.write(sb.toString());
            writer.newLine();
            writer.flush();
            Thread.sleep(1000);
        }
        catch (Exception ex)
        {
            ex.printStackTrace();
        }
    }
}
finally
{
    writer.close();
}
To use those classes instead of the ones from the JDK you need to prepend your jar containing them into the bootclasspath. This way, it is your classes that are looked up before those contained into the rt.jar
-Xbootclasspath/p:contention-profiling.jar
Here is an example of the output of the profiler:
creating lock 0: java.util.concurrent.ConcurrentHashMap$Segment.<init>(ConcurrentHashMap.java:425), java.util.concurrent.ConcurrentHashMap.<init>(ConcurrentHashMap.java:825), sun.util.locale.LocaleObjectCache.<init>(LocaleObjectCache.java:48), sun.util.locale.LocaleObjectCache.<init>(LocaleObjectCache.java:44), java.util.Locale$Cache.<init>(Locale.java:676), java.util.Locale$Cache.<init>(Locale.java:675), java.util.Locale.<clinit>(Locale.java:411), java.lang.String.toLowerCase(String.java:2524), java.net.URL.<init>(URL.java:377), java.net.URL.<init>(URL.java:302), java.net.URL.<init>(URL.java:325), sun.net.www.ParseUtil.fileToEncodedURL(ParseUtil.java:272), sun.misc.Launcher.getFileURL(Launcher.java:460), sun.misc.Launcher$ExtClassLoader.getExtURLs(Launcher.java:192), sun.misc.Launcher$ExtClassLoader.<init>(Launcher.java:164), sun.misc.Launcher$ExtClassLoader$1.run(Launcher.java:148), sun.misc.Launcher$ExtClassLoader$1.run(Launcher.java:142), java.security.AccessController.doPrivileged(Native Method), sun.misc.Launcher$ExtClassLoader.getExtClassLoader(Launcher.java:141), sun.misc.Launcher.<init>(Launcher.java:71), sun.misc.Launcher.<clinit>(Launcher.java:57), java.lang.ClassLoader.initSystemClassLoader(ClassLoader.java:1489), java.lang.ClassLoader.getSystemClassLoader(ClassLoader.java:1474),
creating lock 1: java.util.concurrent.ConcurrentHashMap$Segment.<init>(ConcurrentHashMap.java:425), java.util.concurrent.ConcurrentHashMap.<init>(ConcurrentHashMap.java:825), java.util.concurrent.ConcurrentHashMap.<init>(ConcurrentHashMap.java:861), java.text.SimpleDateFormat.<clinit>(SimpleDateFormat.java:507), java.util.concurrent.locks.ReentrantLock$1.run(ReentrantLock.java:155),
[...]
2014-09-19 16:22:08.394 125=4, 233=143306, 234=25248, 275=10, 276=1, 293=1, 294=1, 333=3, 361=1, 389=1, 6453=1,
The line creating lock n indicates where the lock id n is created. The line with equals reports you for a locking id (left of the equal), the number of time that lock has contended (right of the equal).
Then it helps you to focus and work on the most contented ones first.
And remember: Measure, Don’t Premature!